
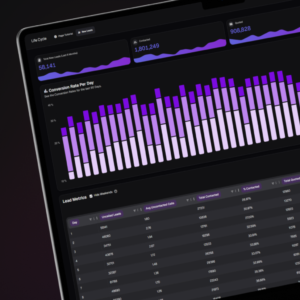
Daily Calls Overview
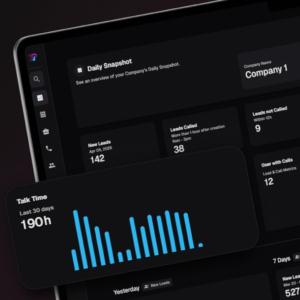
Daily Snapshot
This page gives teams a simple, reliable read on how the day is unfolding.Spam Guru Pro Dash
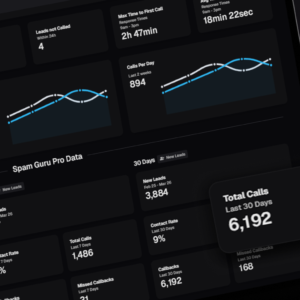
Spam Guru
It provides clear visibility into intake, follow-through, and calling rhythm within a single reporting moment.Gamification Dashboard
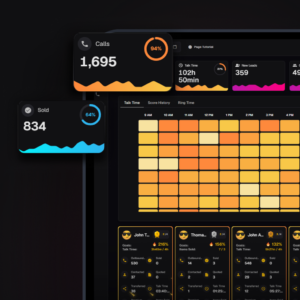
Performance Dashboard
Reinforce goals and recognition through visible leaderboards and animated feedback.Agent Dashboard
Agent Dashboard
Center every metric on a single person so feedback, planning, and recognition stay specific and fair.HR Platform
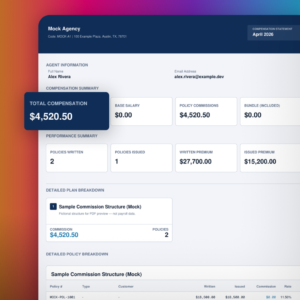
Human Resources
Define how people are paid, assign Compensation Plans to individual users or teams, manage Payroll, Bonuses, and much more.Agency Policy Dashboard
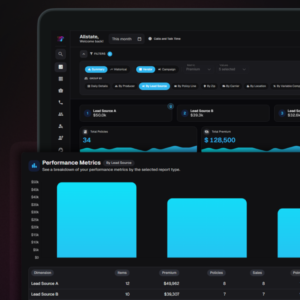
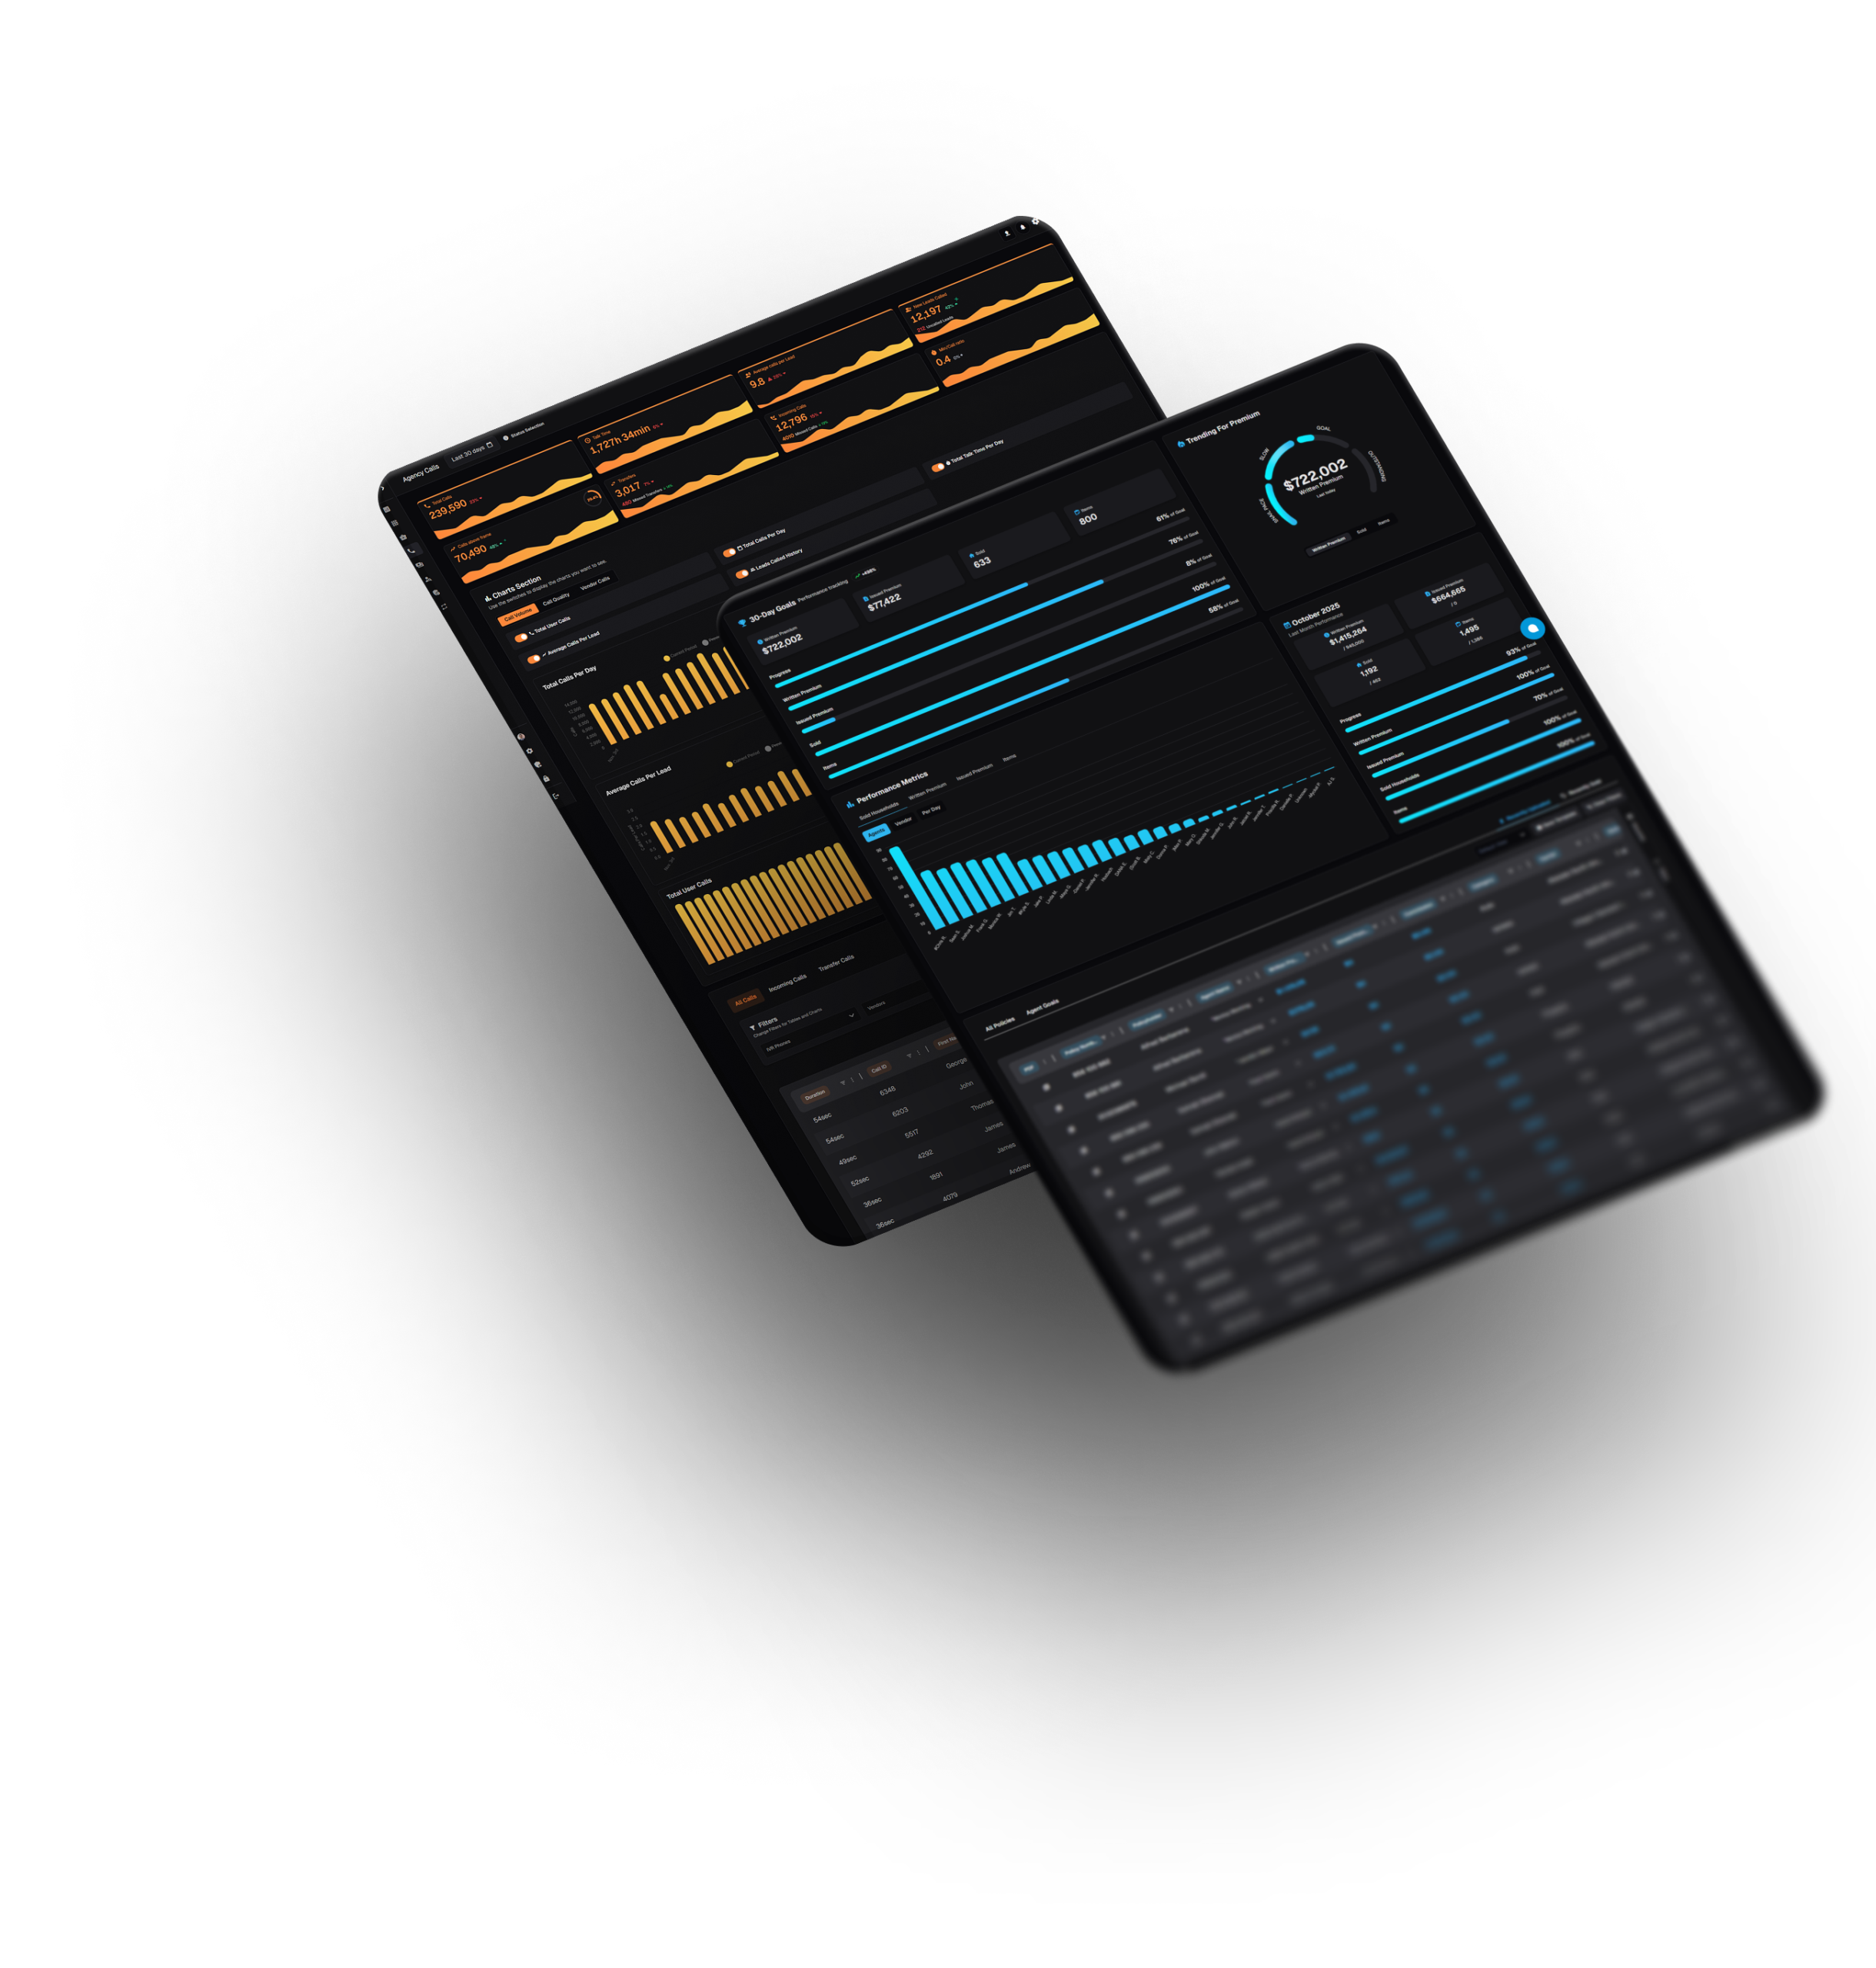
Agency Policy Dashboard
Brings premium sales, production, and mix into a single workspace: who's leading, how the office is tracking to goals, and how performance varies by segment.Policy Tracking & Management
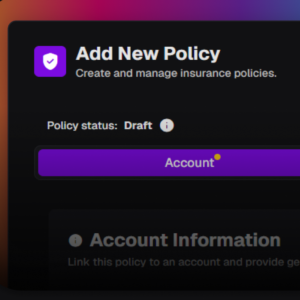
Insurance Policies
Search across rows to find a policy quickly, use row actions for common follow-ups, and open the add flow to capture new entries.Referral Forms
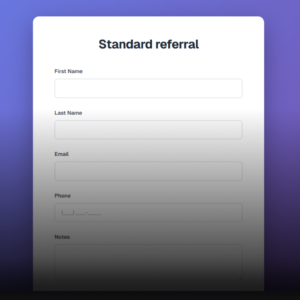
Referral Forms
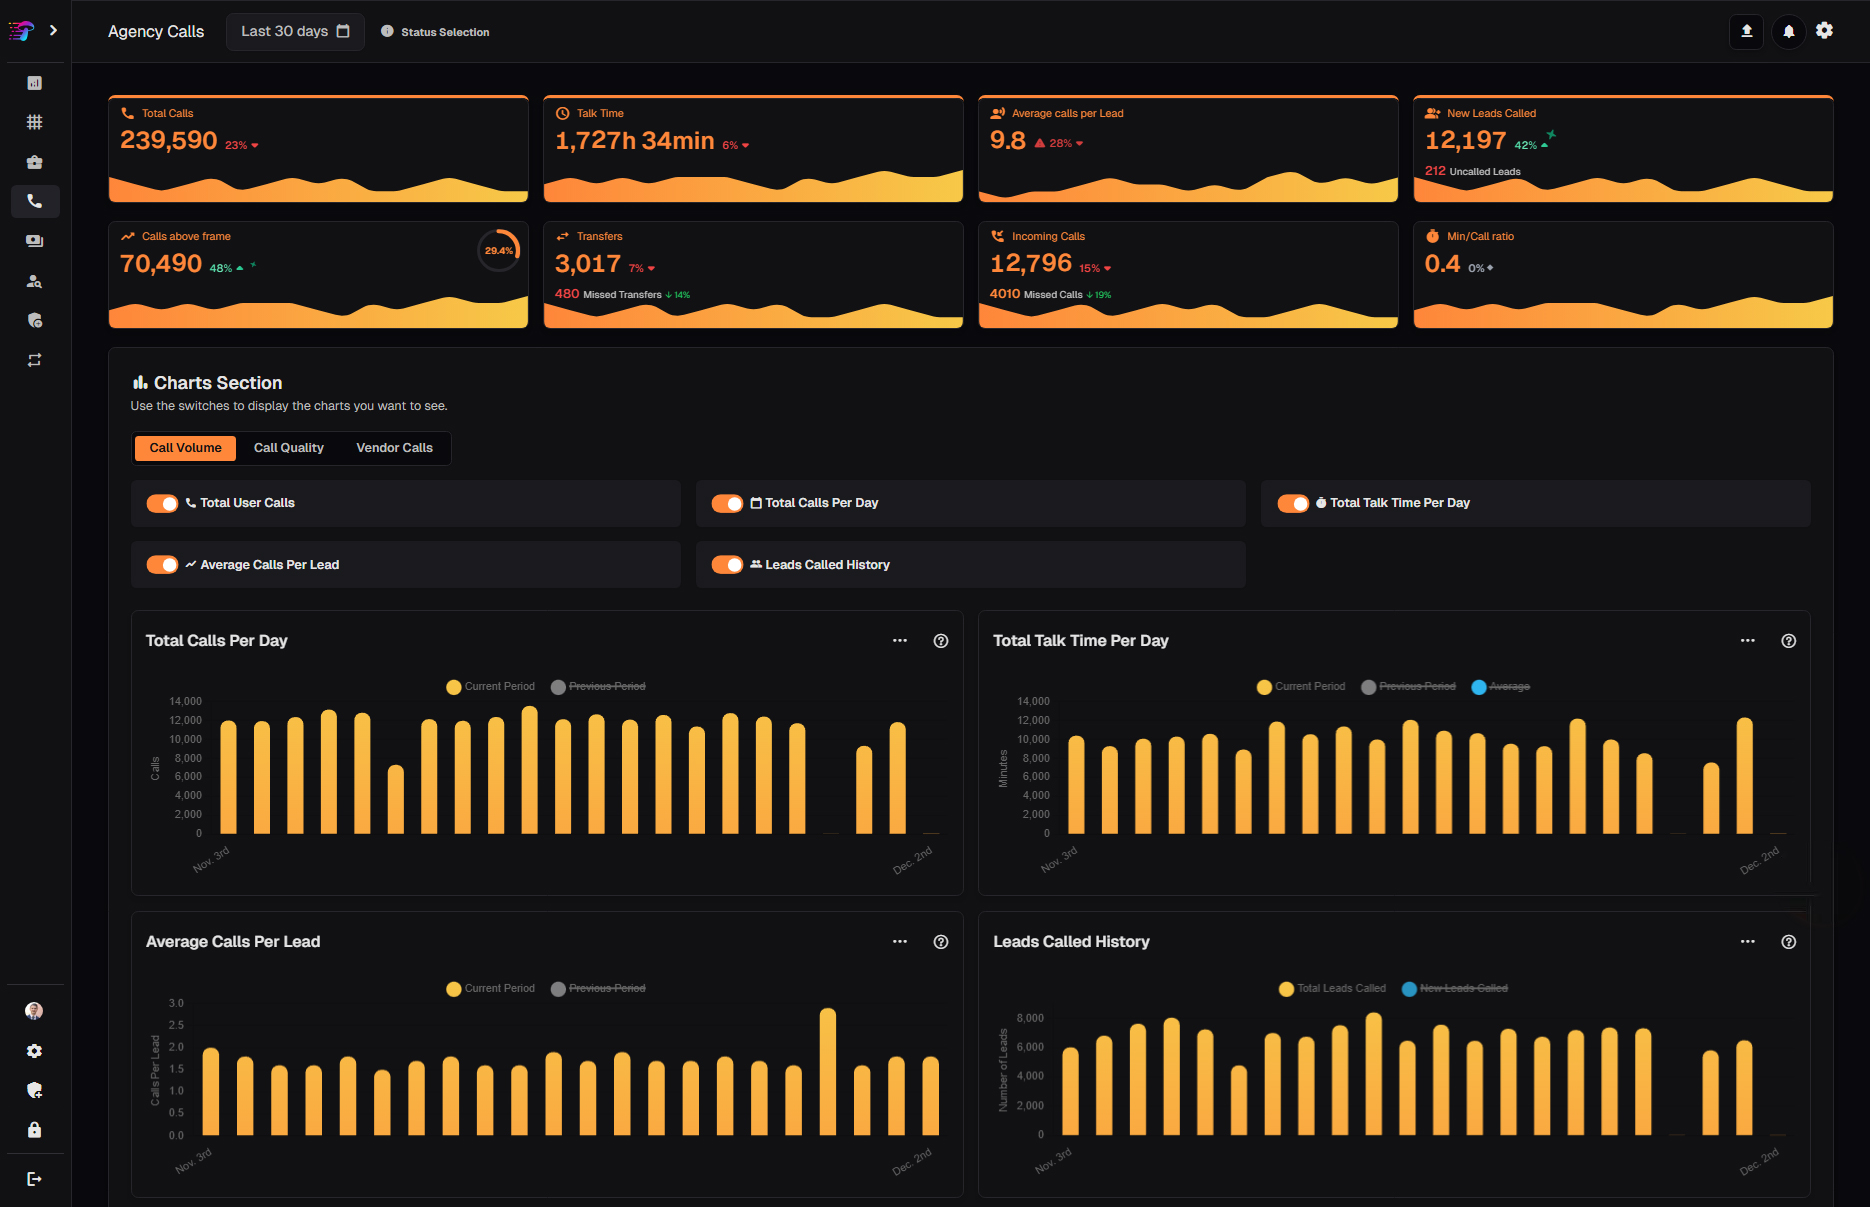
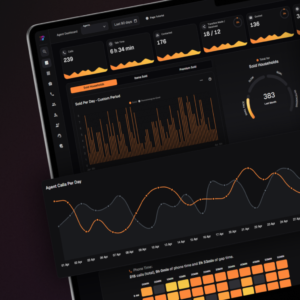
Design referral capture once and reuse it everywhere. Choose or create a template, build questions in a visual editor and send submissions to your own endpoint.Call Analytics
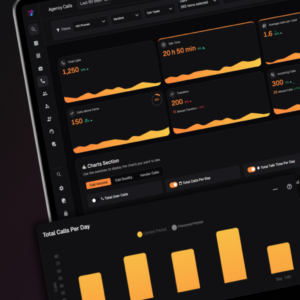
Agency Calls
This page is the main workspace for outbound and inbound activity across owners, teams, vendors, and lines.Vendor Performance
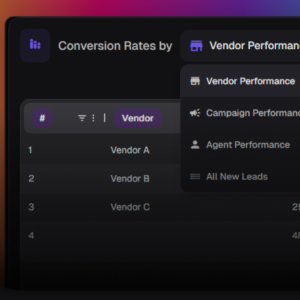
Vendor Dashboard
Understand how external lead sources are performing. Filter by timeframe and partners, compare results consistently, and switch between views.Campaign Performance
Performance
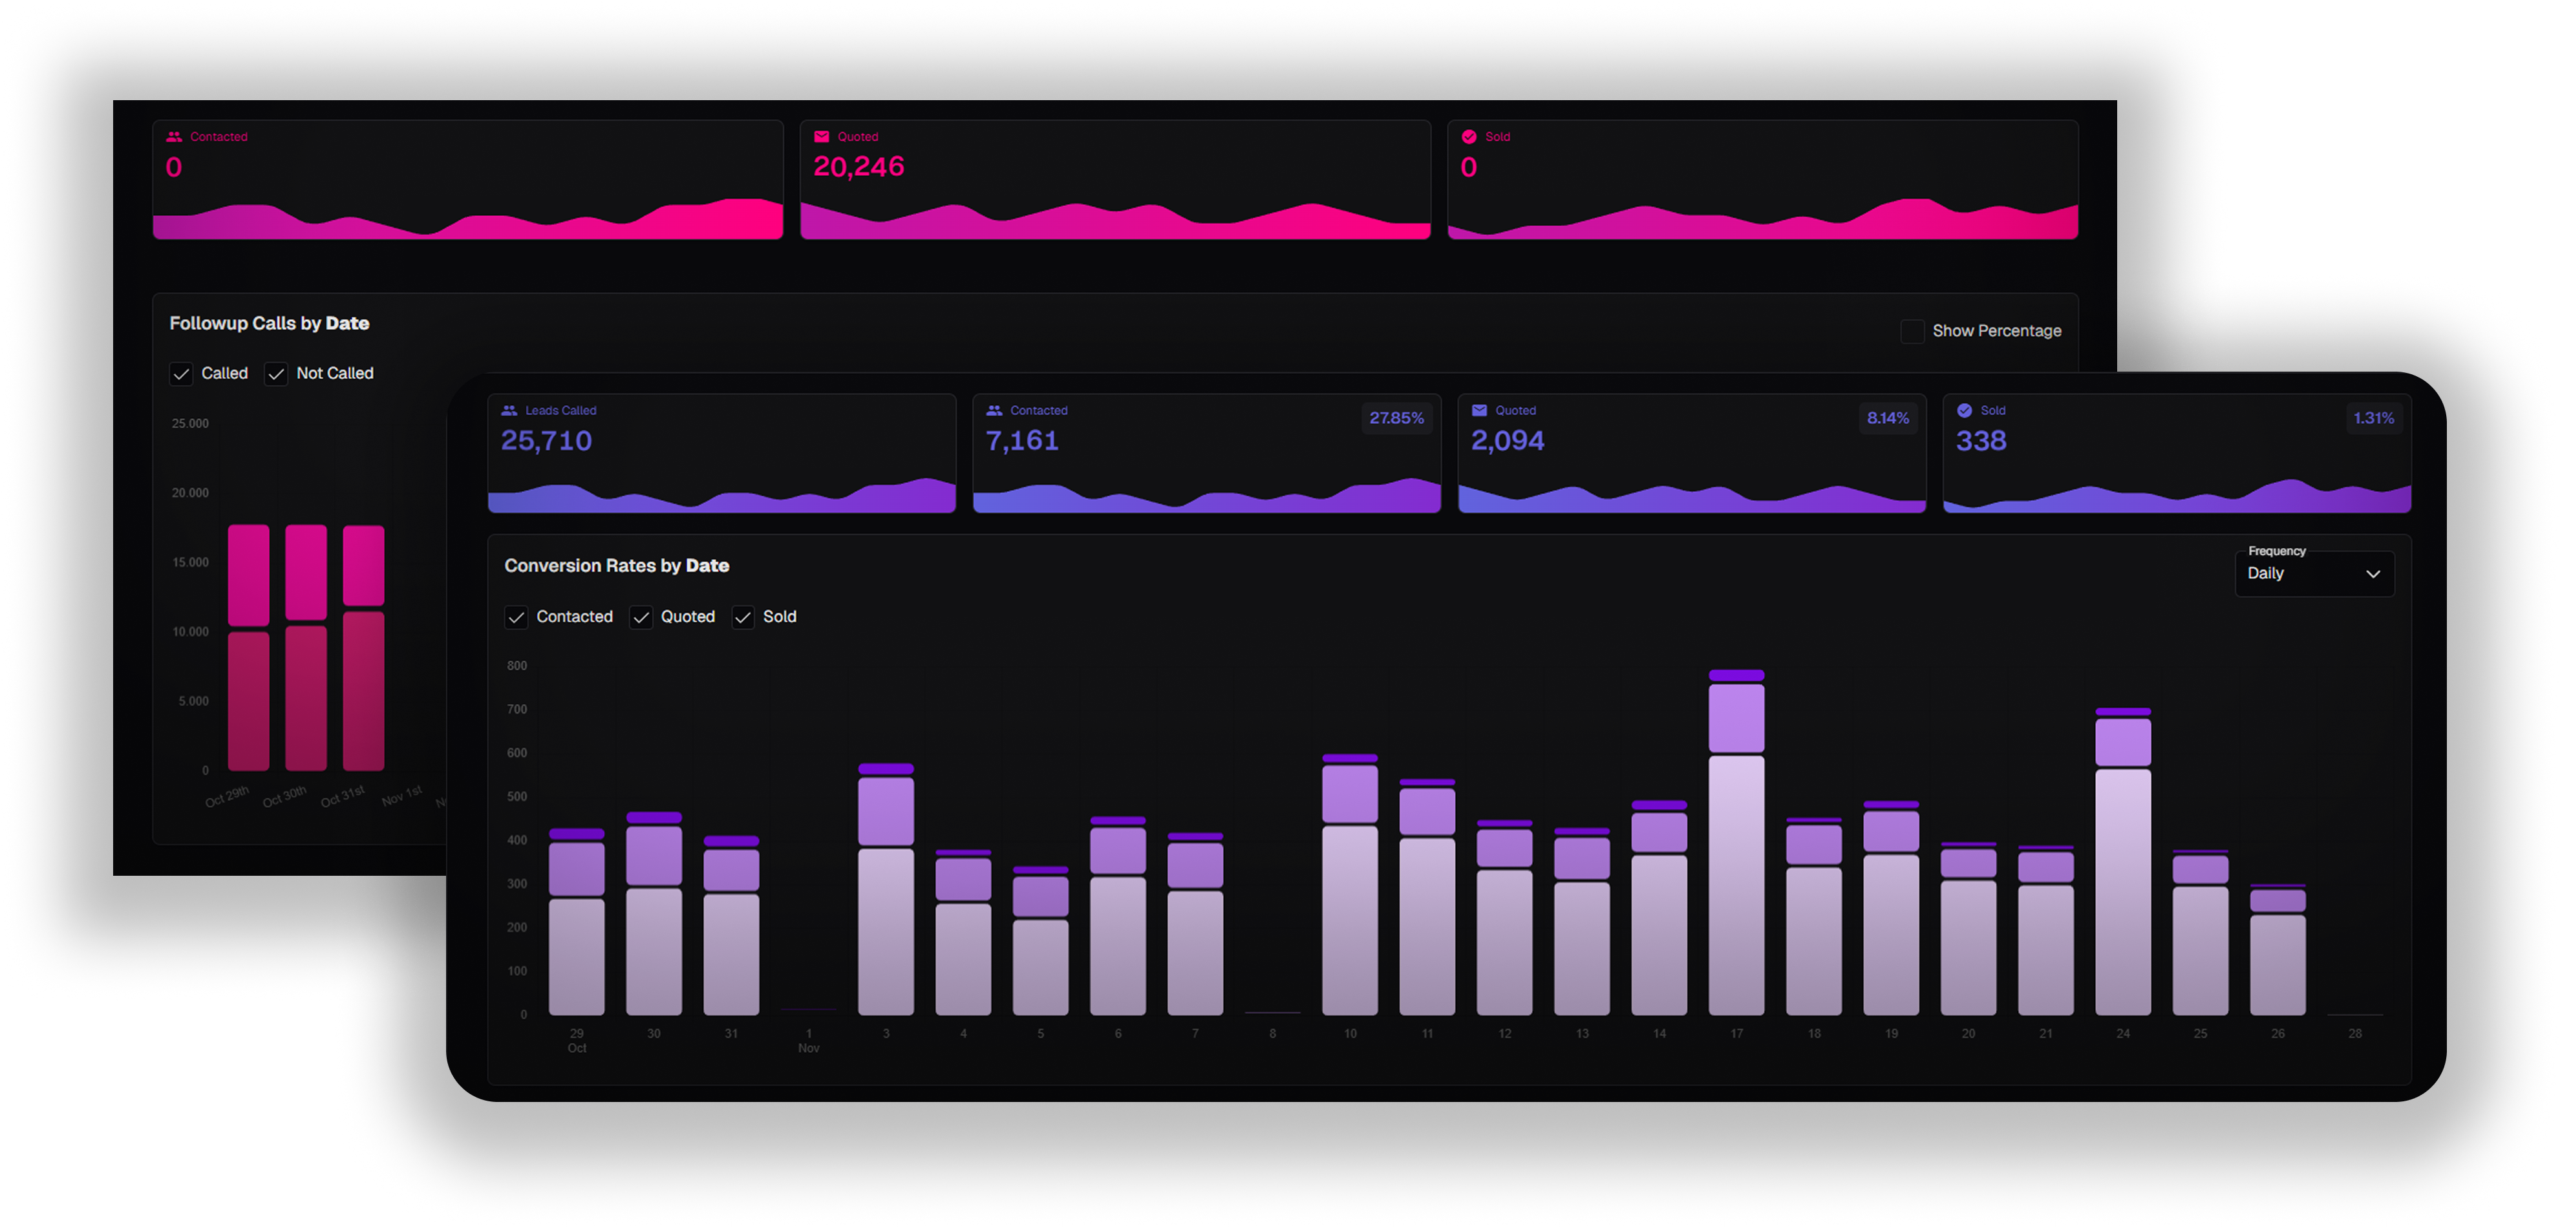
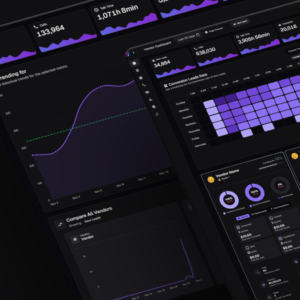
This page helps teams understand funnel health by showing how effort turns into progress and how that changes over time and across programs.Regional Performance Tracking
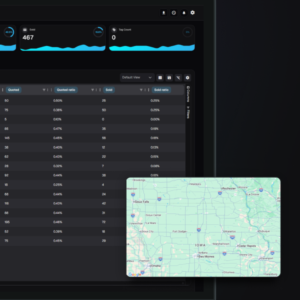
Zip Code Leads
This page helps teams understand lead performance by location, highlighting where demand is concentrated, how conversations vary, and where follow-up may be uneven.Advanced Heatmaps
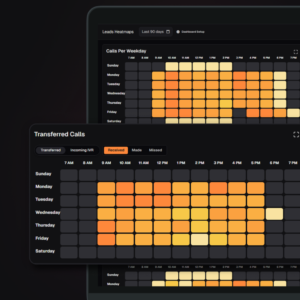
Heatmaps
This page shows call and lead activity as clear time patterns. Adjust vendors, dates, days, teams, people, and hours.Followup Calls Review
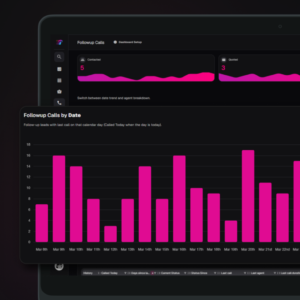
Followup Calls
Focus on leads after first contact, showing how many move through contacted, quoted, and sold stages, how follow-up volume changes over time, and how agents compare.Goal History Tracking
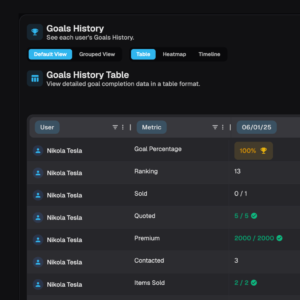
Goals History
Review how each person performed against their goals over time—tables, heatmaps, and timelines of completion and trends.Lead Management System
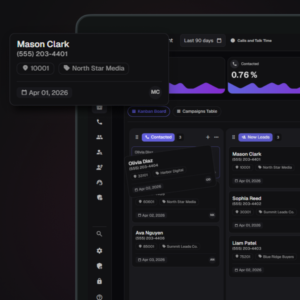
Leads Management
Bring campaigns, lead volume, and funnel outcomes together in one workspace. Filter what matters, review key metrics at a glance, then switch between a Kanban Board or a detailed table.Speed to Lead Performance
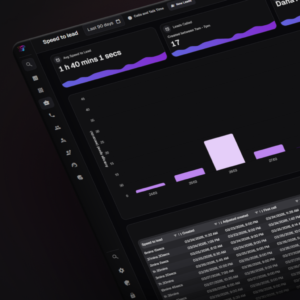
Speed To Lead
Visualize how response times cluster over the selected period so outliers and consistent delays are easy to spot in reviews.Lead Lifecycle Report
Life Cycle
This page helps teams understand how leads move over time and how that differs by source when compared fairly.Phone Matrix
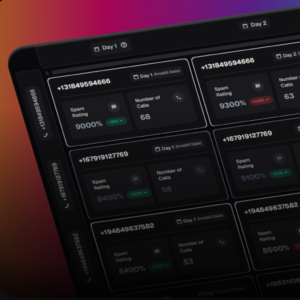
Spam Matrix
Scan multiple calling identities across a timeline of labeling and risk evolution, making it easy to spot outliers, trends, and gradual deterioration.Vendor Matrix
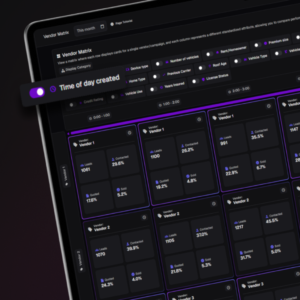
Vendor Matrix
This page helps leaders compare lead sources side by side using the attributes that matter most to the business.Status Matrix
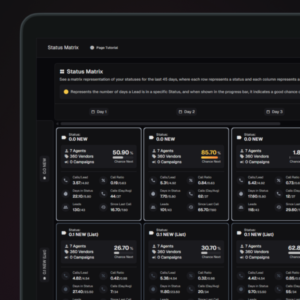
Status Matrix
This view keeps teams focused on the sales pipeline by showing how much work exists, how it moves, and where it slows down.Agent Matrix
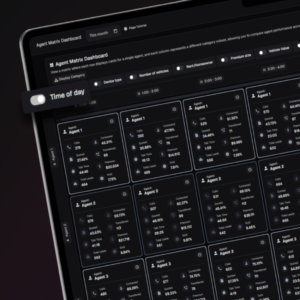
Agent Matrix Dashboard
This workspace enables fair, structured comparison of producers across the segments that define your business.Call Cadence Reporting
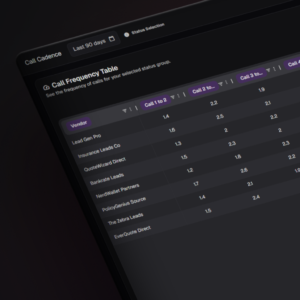
Call Cadence
This page focuses on rhythm: how often leads are contacted and how effort shows up across vendors and stages.AI Custom Dashboard Builder

Agent Builder
Combine a conversational assistant with a live canvas of cards and charts. Describe what you need, refine it in chat, then arrange and adjust what appears.