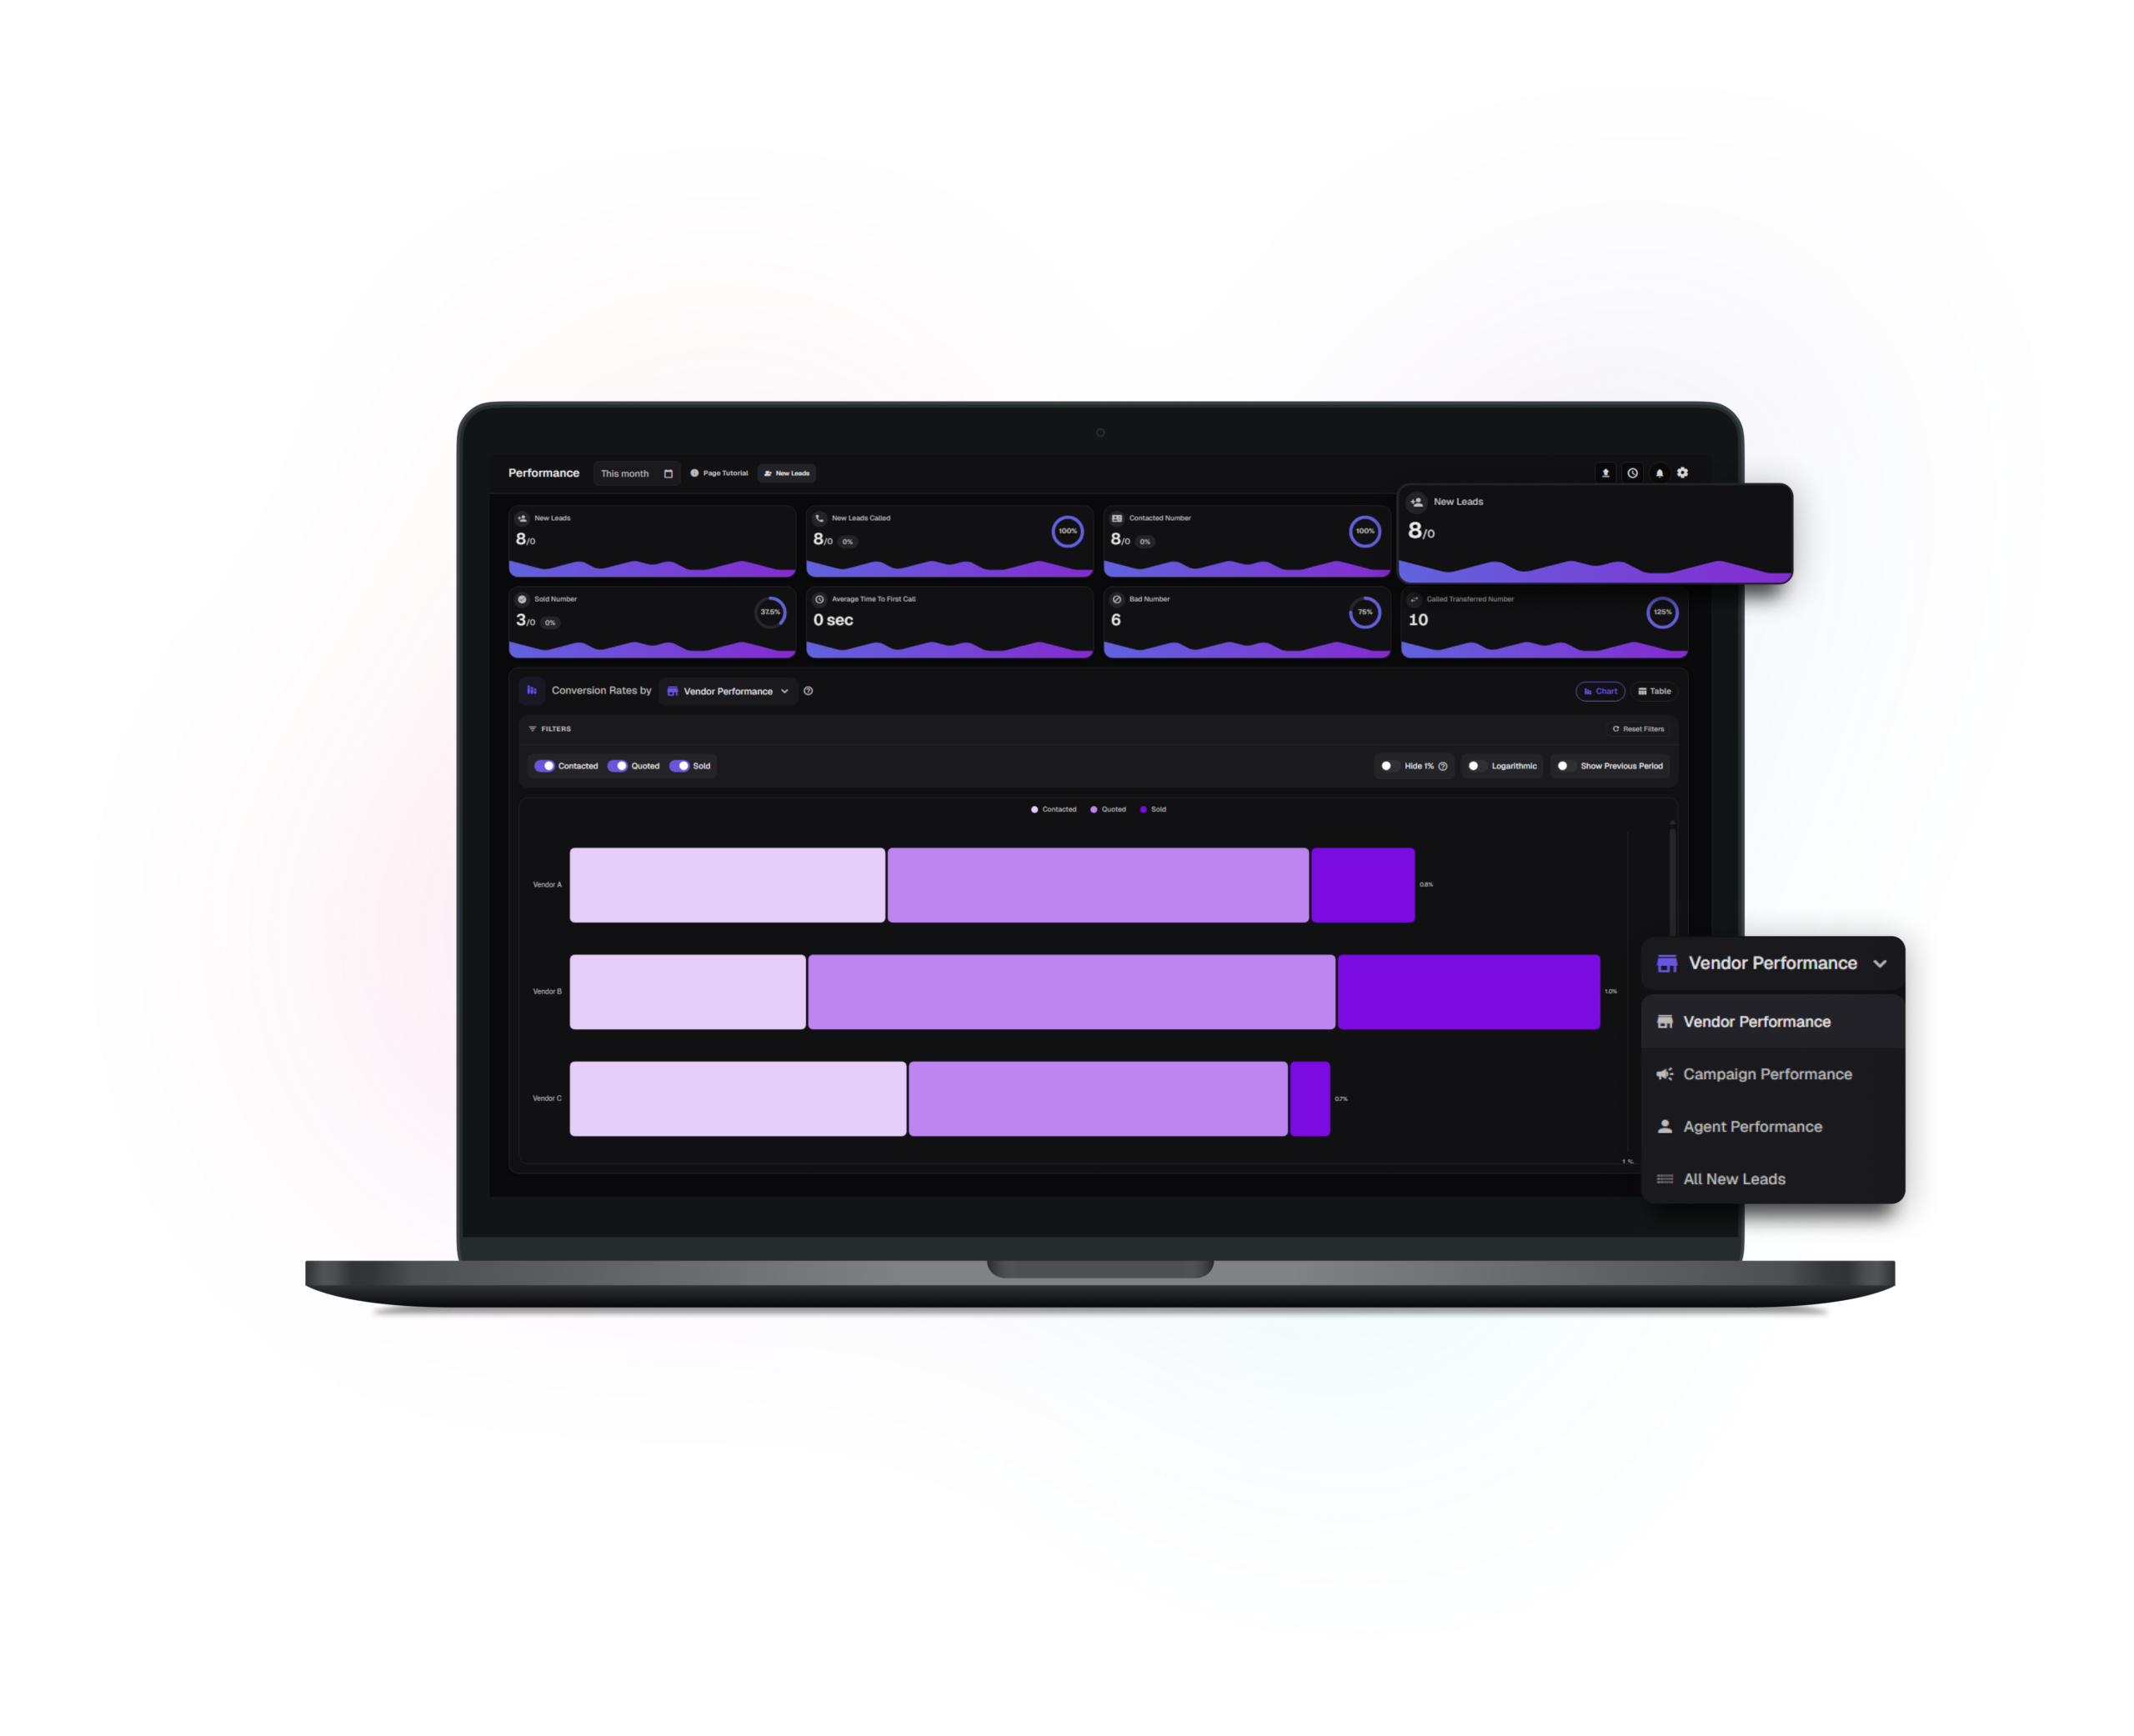
This page helps teams understand funnel health by showing how effort turns into progress and how that changes over time and across programs. Filters let you focus on the tags and timeframes that match your decision. Summary tiles give a quick overview, while trends and comparisons add context and direction. Tables support deeper analysis and benchmarking when needed.
Understand trends and relative performance across your selected period so improvements, declines, and seasonality become clear early.
tables
Support deeper review when stakes are higher
Shift into detailed and comparative views for period closes, partner conversations, and operational audits, where precision and traceability matter as much as the headline.