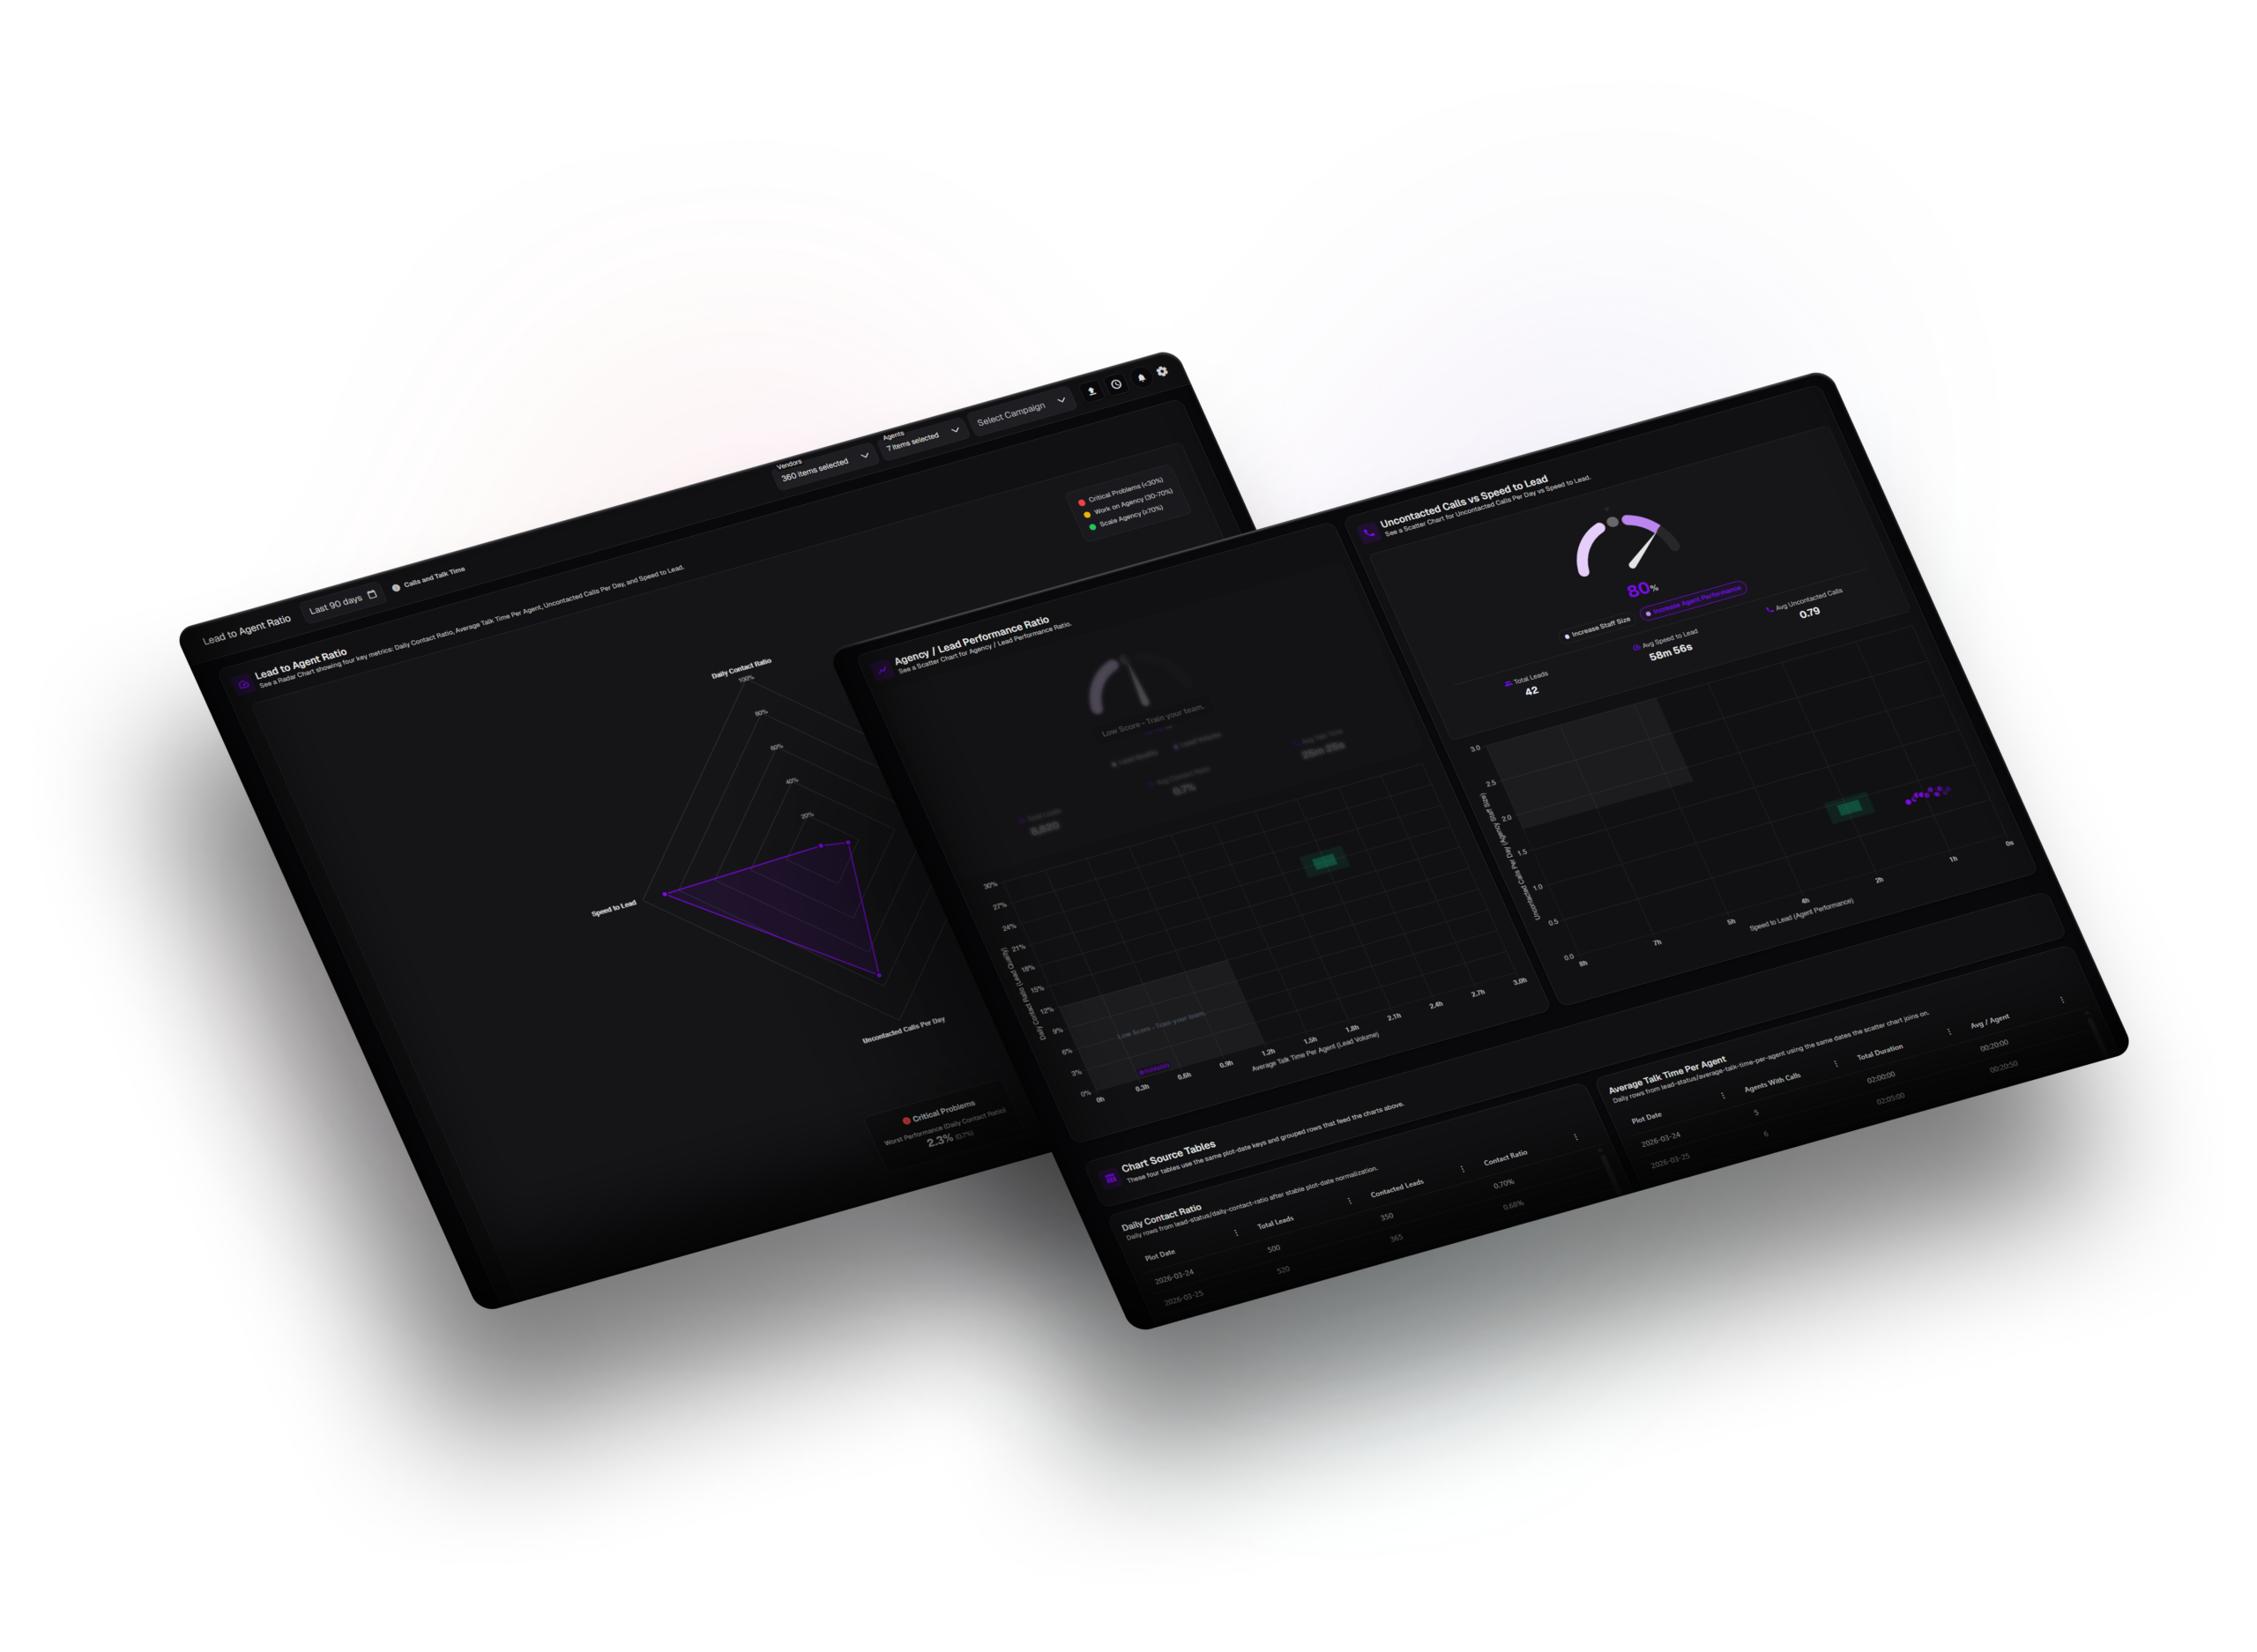
Measure how well your organization keeps up with inbound demand. A multi-metric radar gives a single snapshot of contact cadence, talk time, follow-through gaps, and responsiveness—then paired scatter views and gauges translate that story into quality versus volume and staffing versus performance, with drill-down tables tied to the same dates.
Filter by date, vendor, campaign, owner, and team so leadership sees the right group. Settings let you adjust chart ranges for fair comparisons across high and low activity periods.
Radar overview of four operational signals
One chart blends daily contact ratio, average talk time per agent, uncontacted-call load, and speed to lead—useful for spotting imbalance before it shows up in revenue.
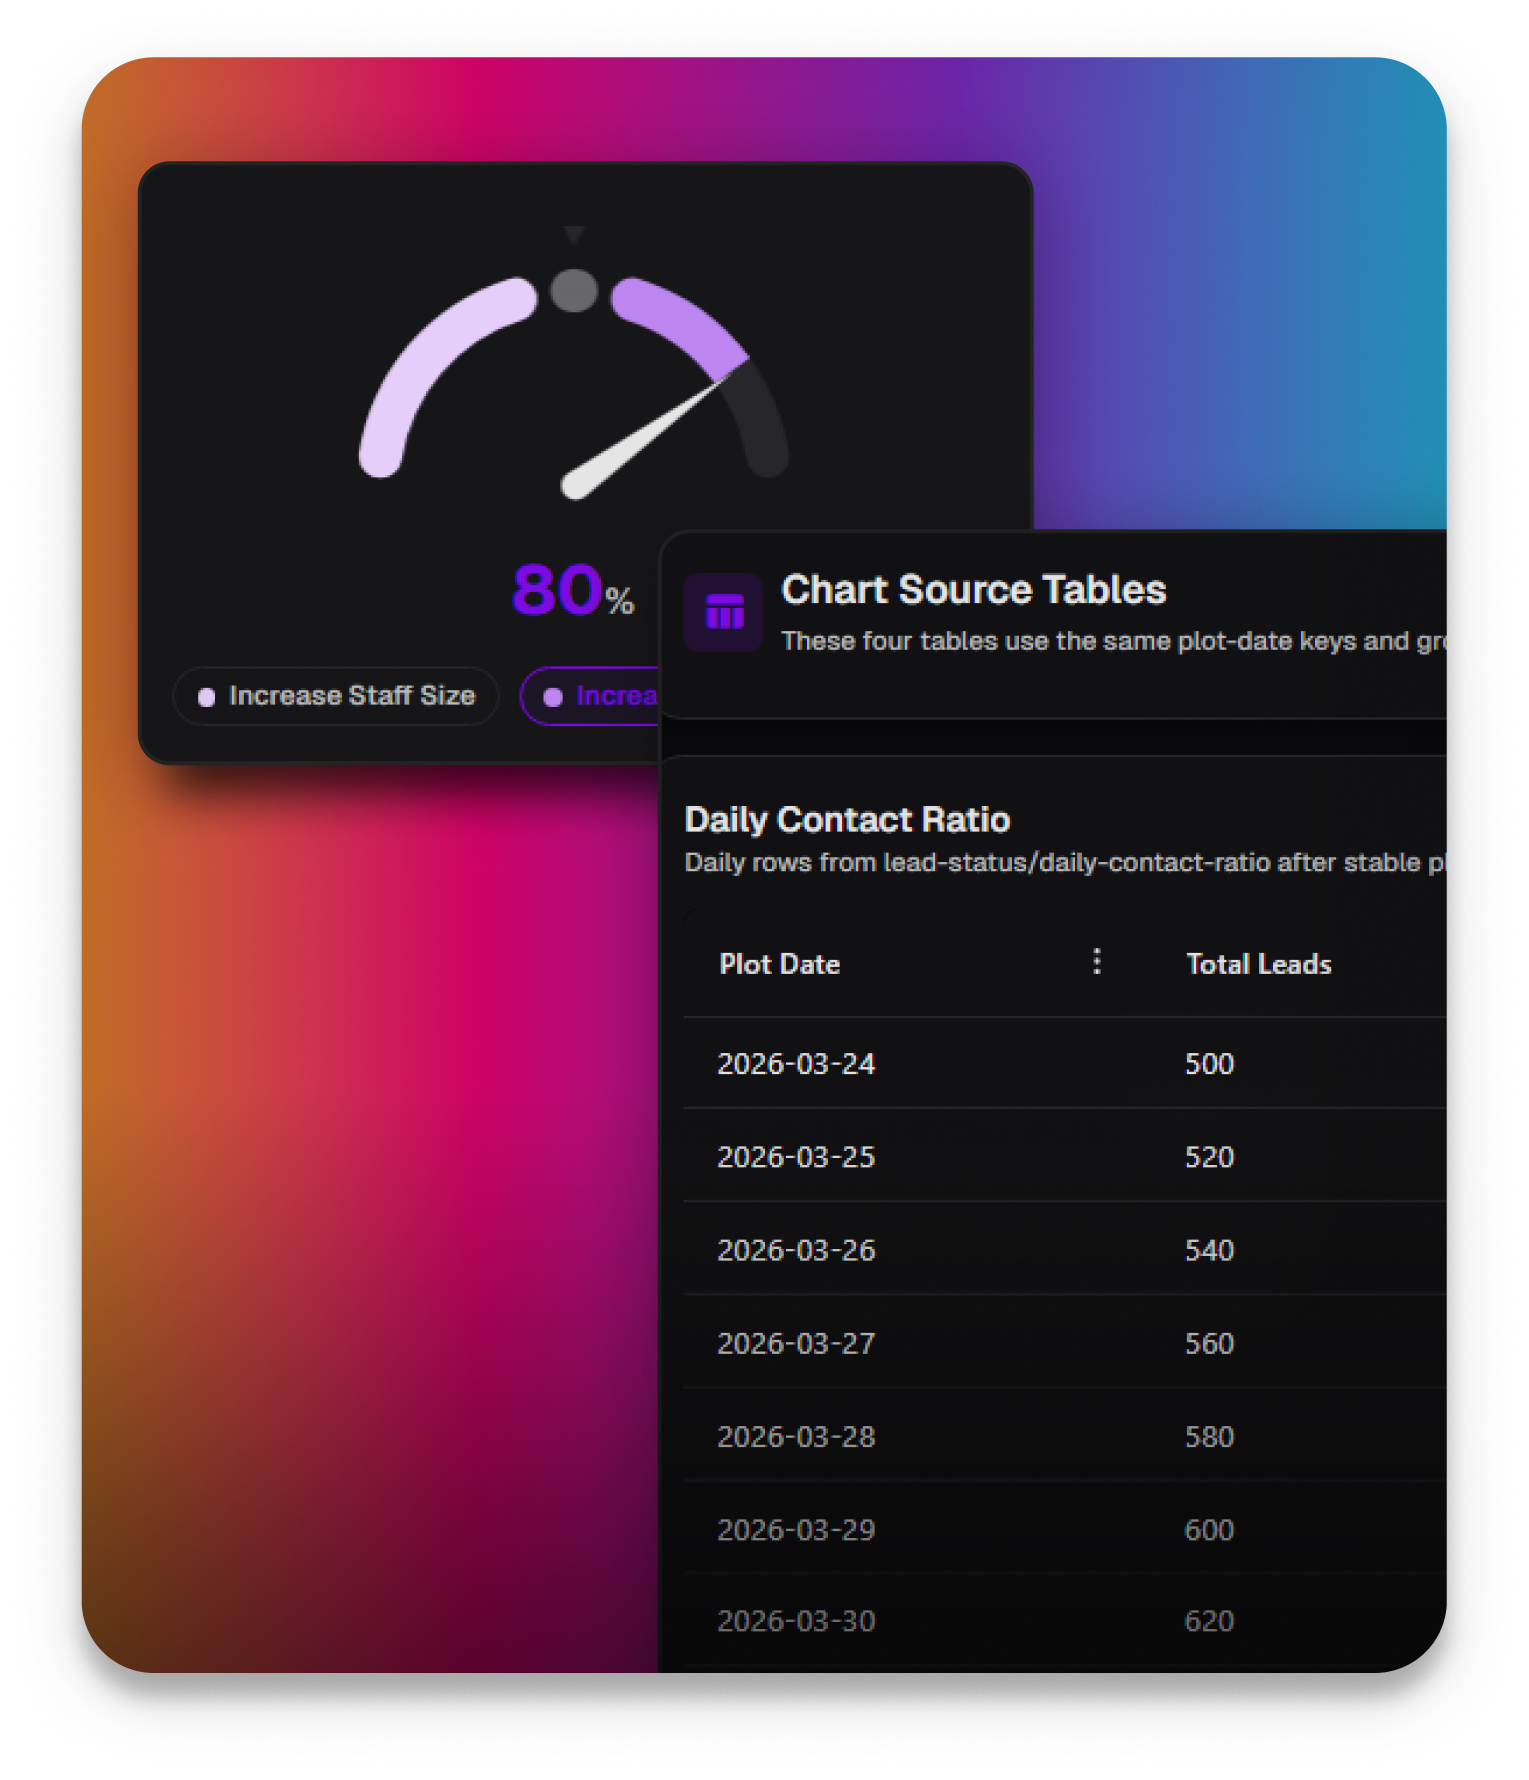
Scatter plots, gauges, and transparent source data
Deep-dive cards relate agency performance to lead outcomes and map uncontacted volume against speed to lead, with summary gauges and export-style tables that mirror what powers the visuals.