This page treats responsiveness as a management metric, grounded in your selected time window and the group you’ve defined. Speed strongly influences conversion and experience, with slow responses reducing intent and fast, consistent outreach building trust over time.
charts
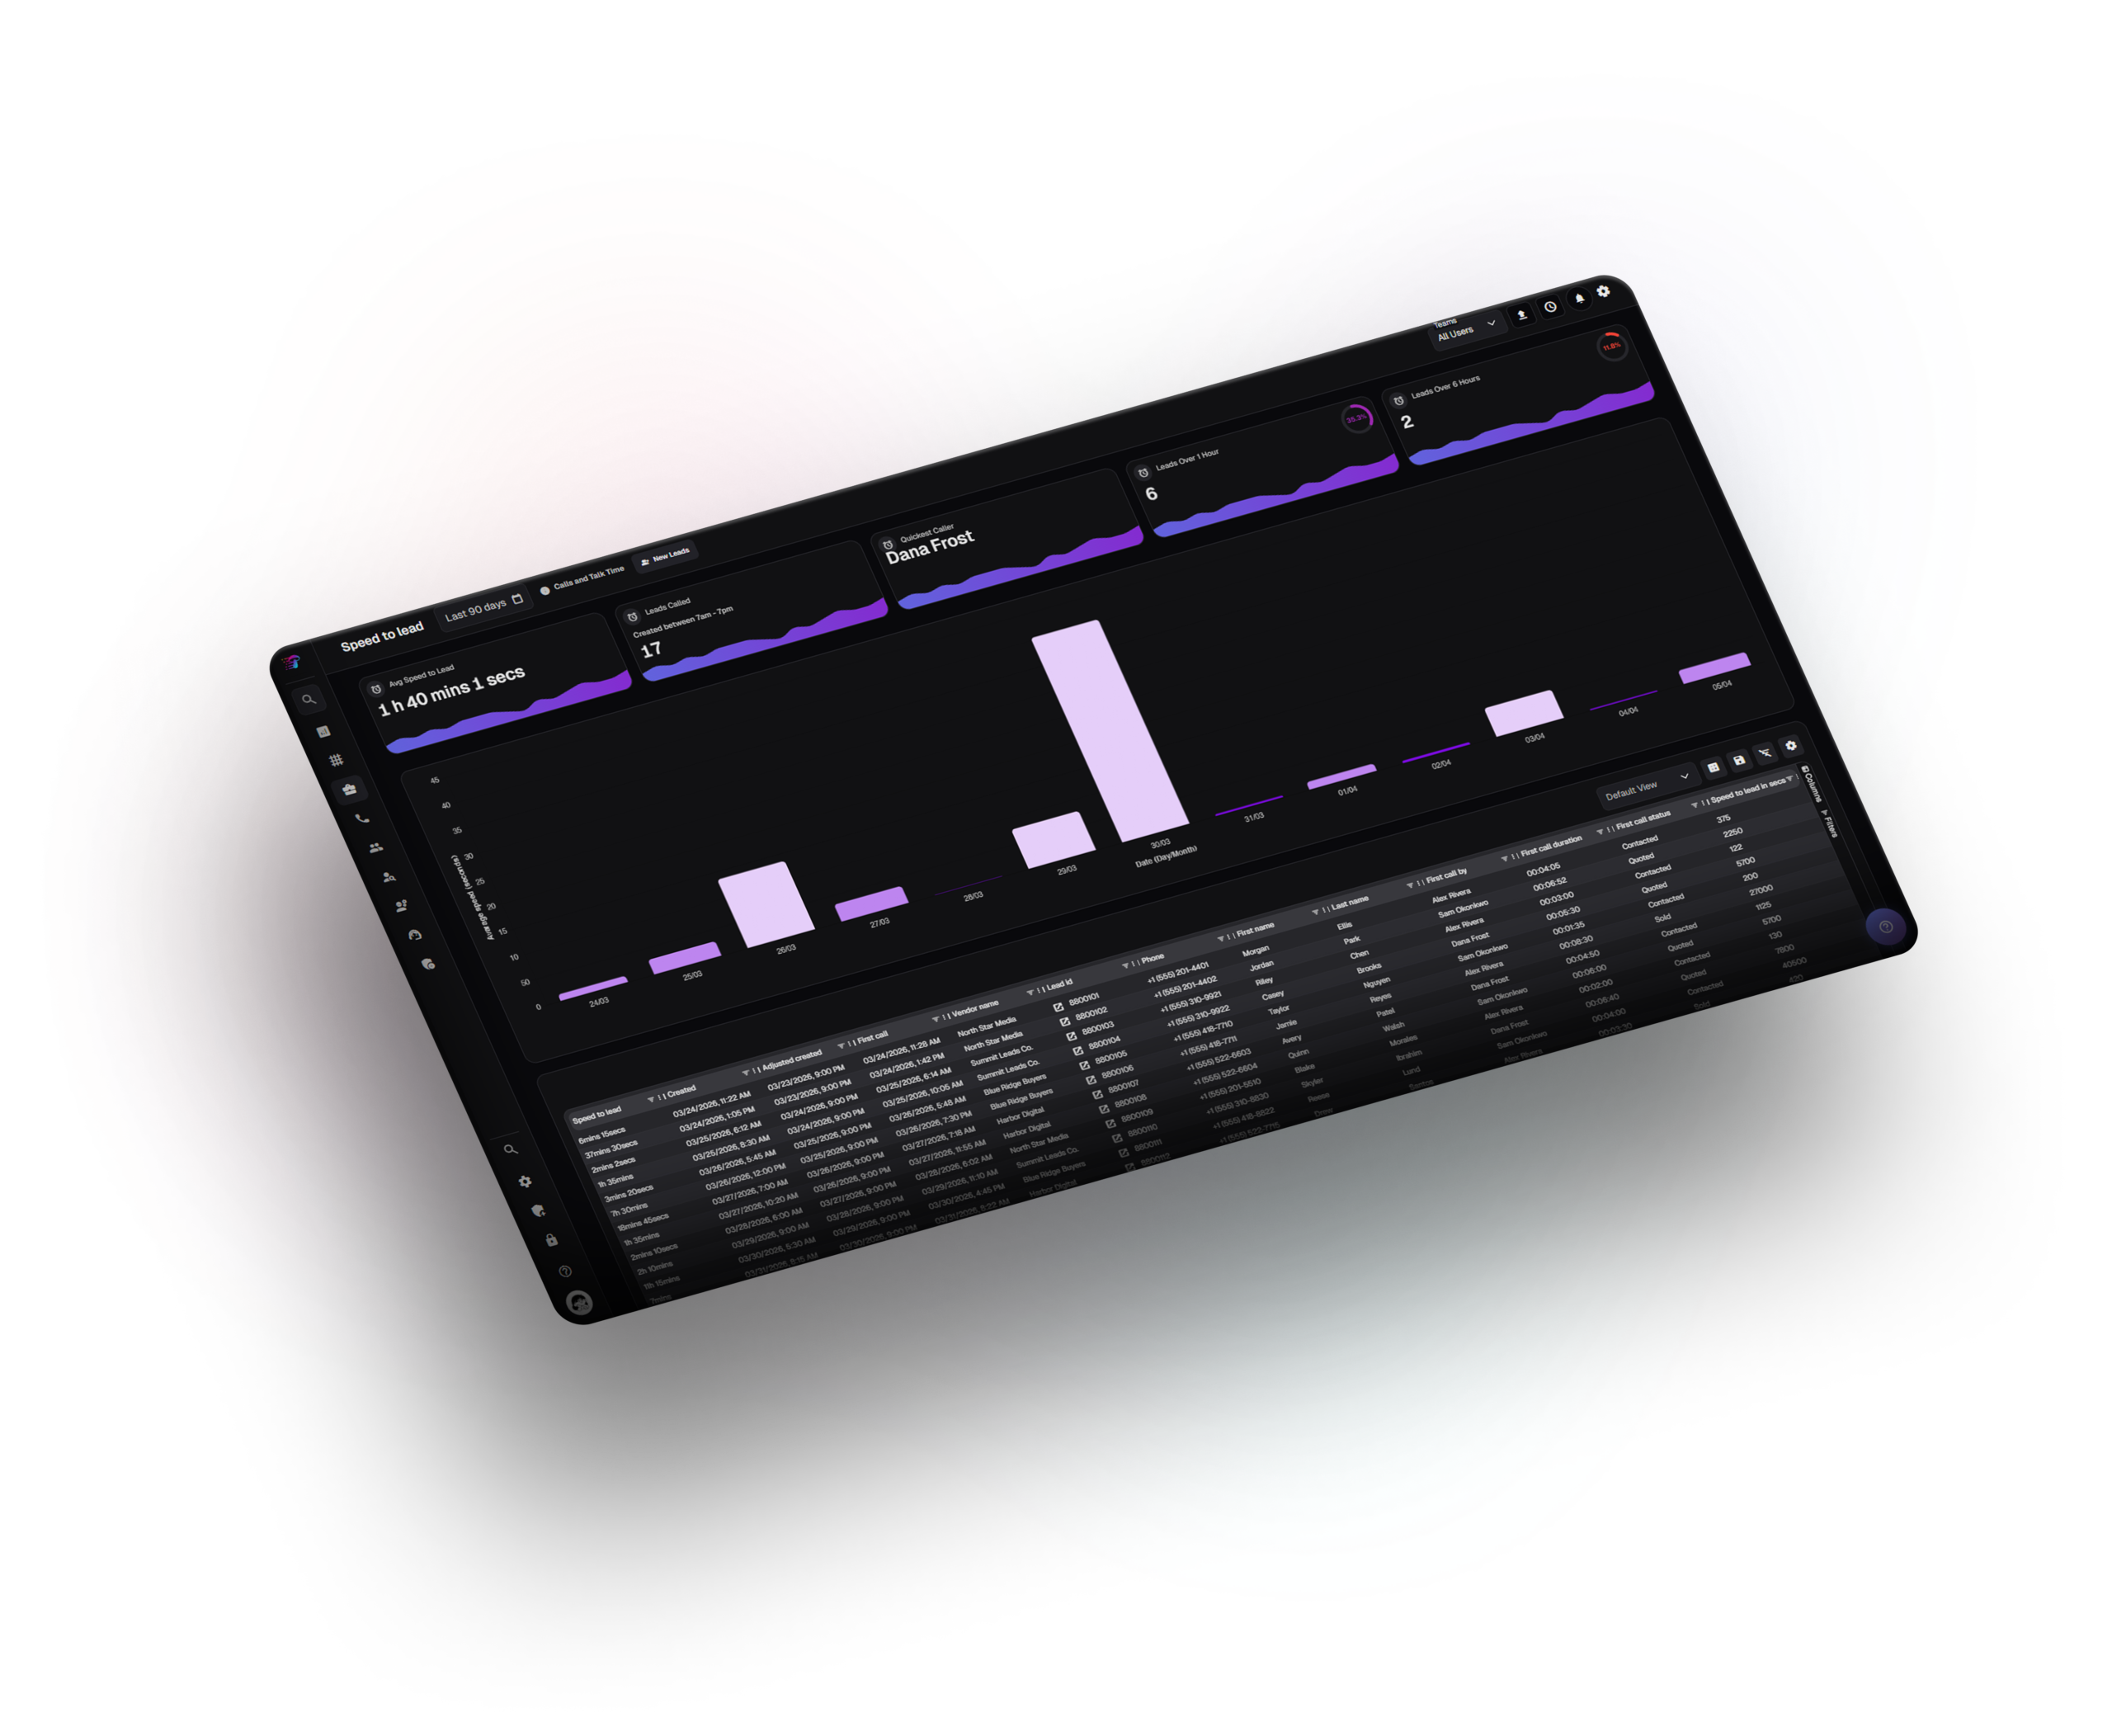
See distribution and concentration
Visualize how response times cluster over the selected period so outliers and consistent delays are easy to spot in reviews instead of being hidden in a single average.
table
Drill to leads and owners
Move from summary to detailed rows for quality checks, coaching, and exceptions, so follow-ups and process fixes are tied to real records, not just charts.