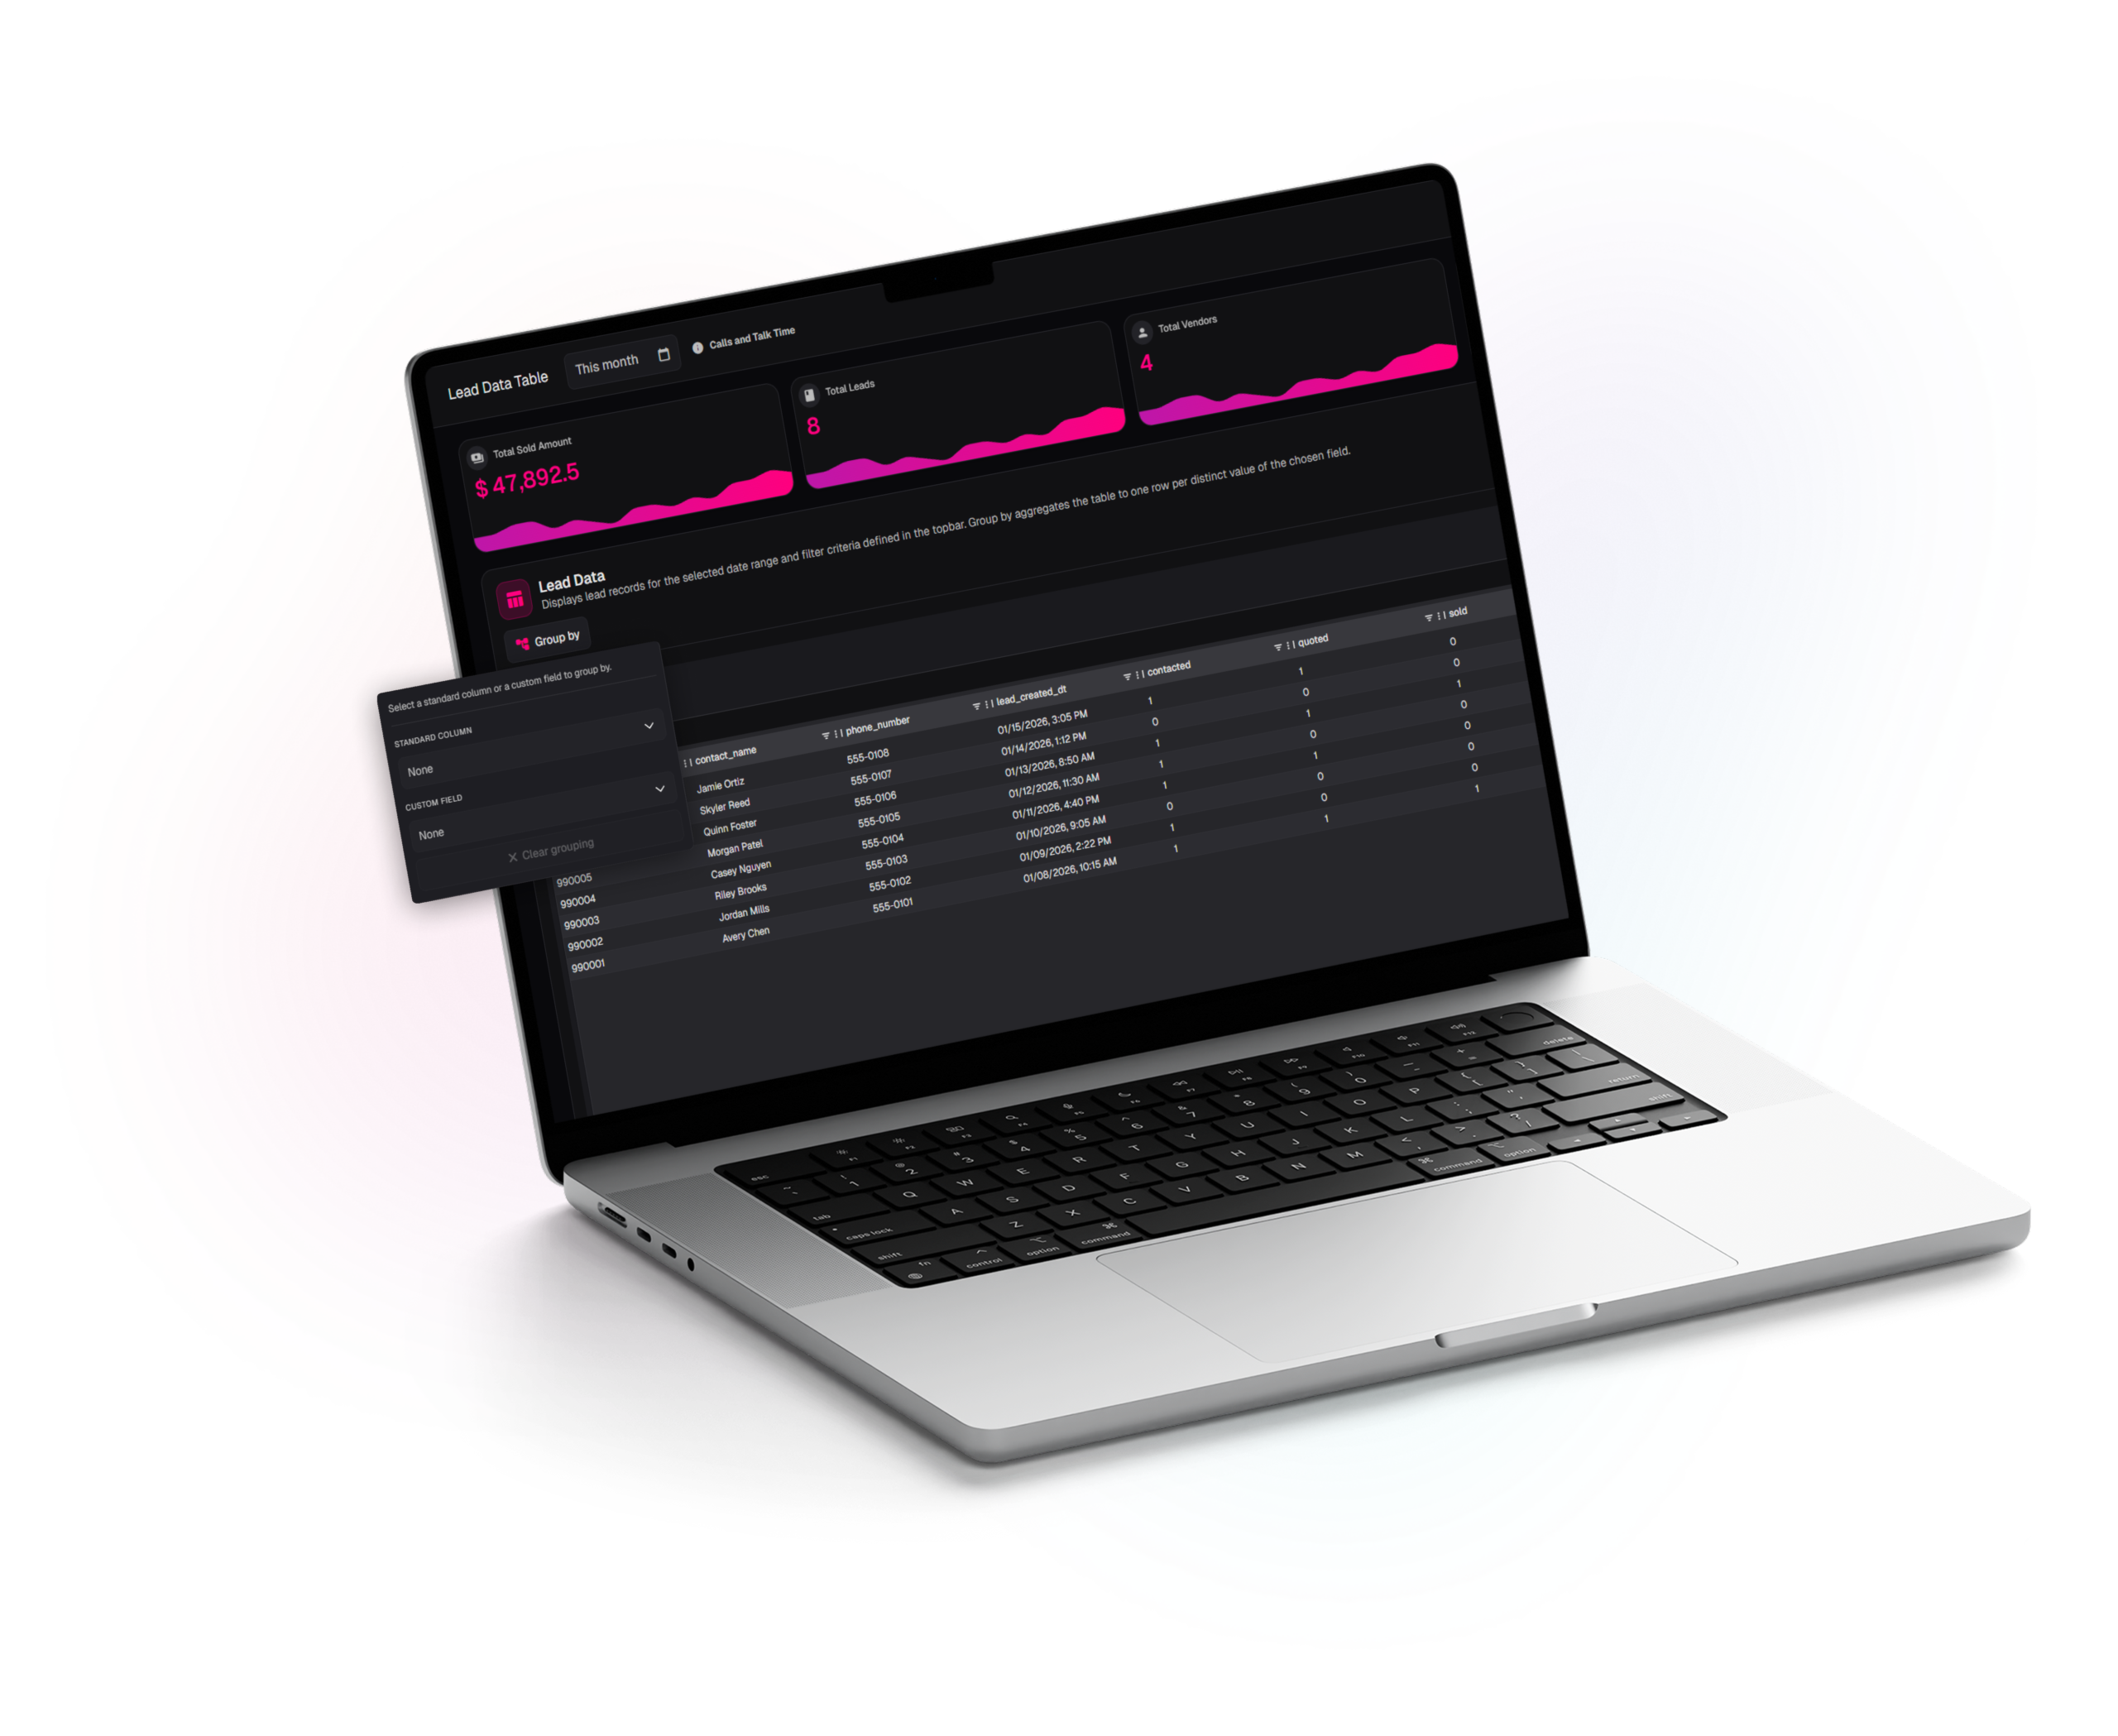
View leads across the dates and regions you choose with flexible filters. Summary tiles highlight revenue, volume, number of vendors, and source mix at a glance, while the main table shows full record details with grouping and export when you need deeper analysis.
table
Date-scoped lead rows
Filters control which leads appear in the grid, keeping analysts within the same time window while they sort, adjust columns, and review individual records.
group data
Group, sort, and export
Group the grid by a standard or custom field to see one row per value, then use familiar tools like sorting and CSV export for quick reporting without leaving the page.