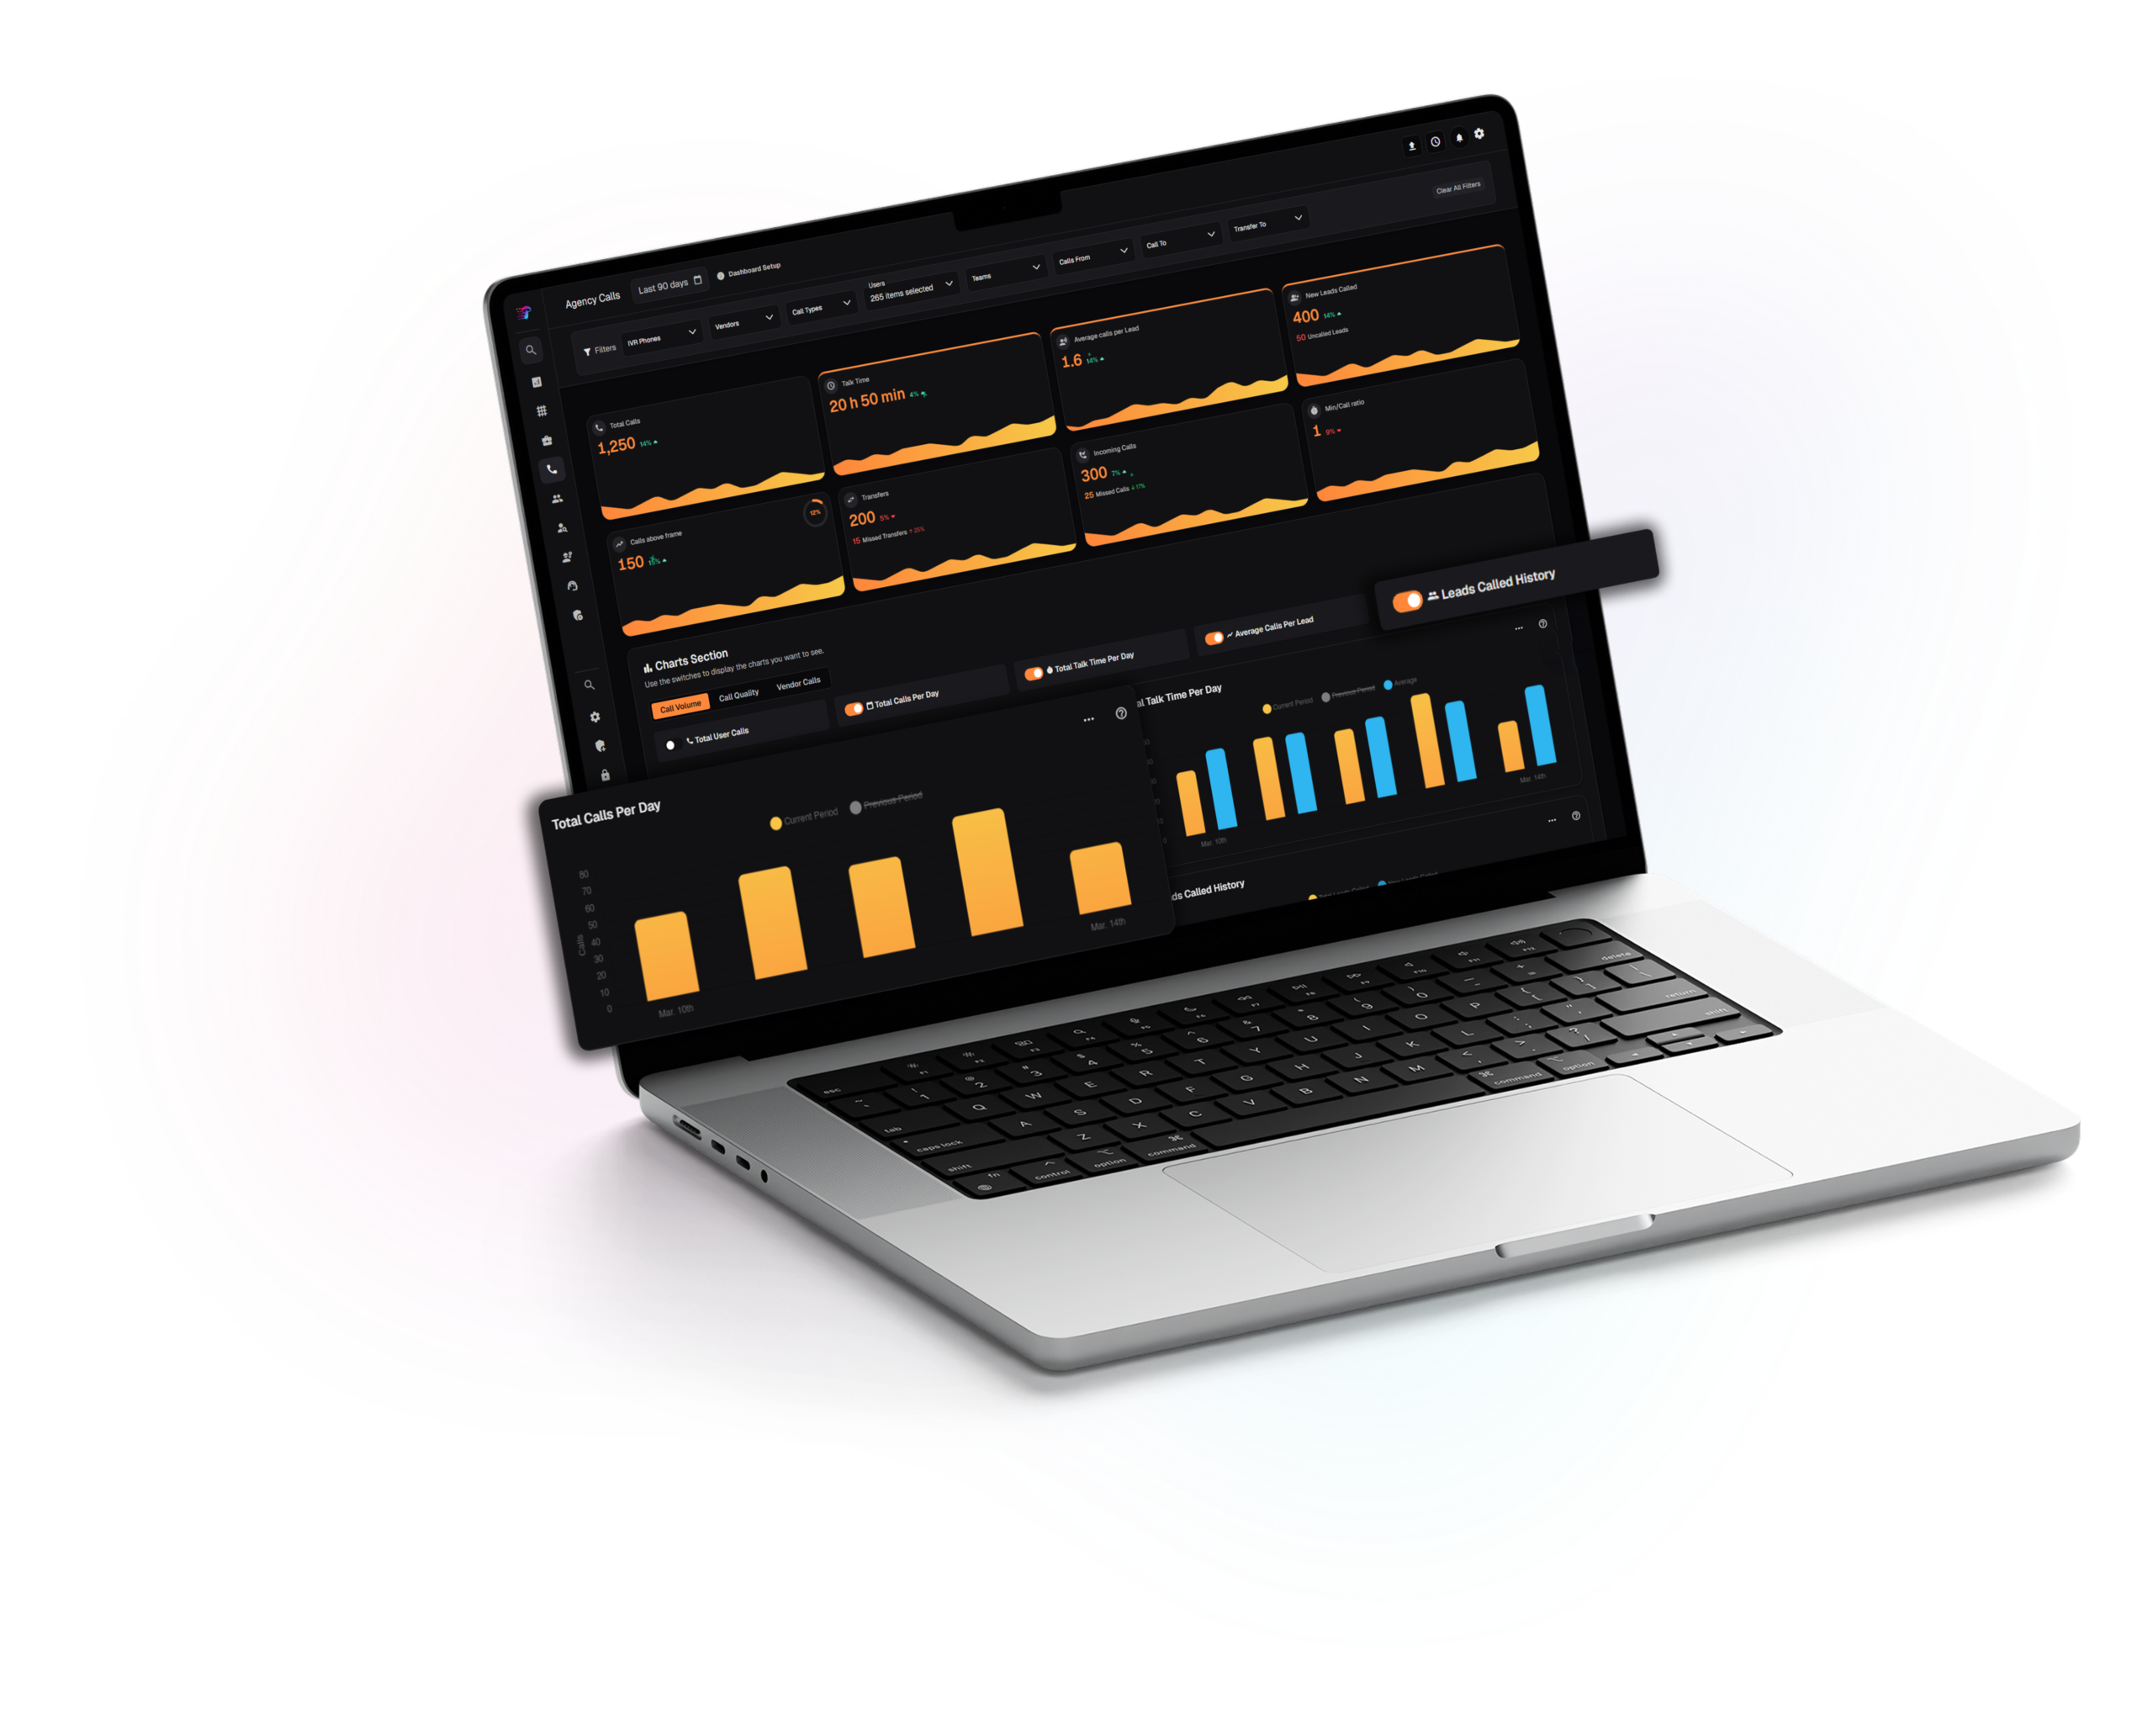
This page is the main workspace for outbound and inbound activity across owners, teams, vendors, and lines. Filters at the top narrow the data, while summary cards highlight volume, talk time, lead coverage, and handoff quality with period comparisons. You can choose which charts to view by volume, quality, or vendor, then scroll down to a detailed call table for deeper analysis.
Modular charts plus a full call listing
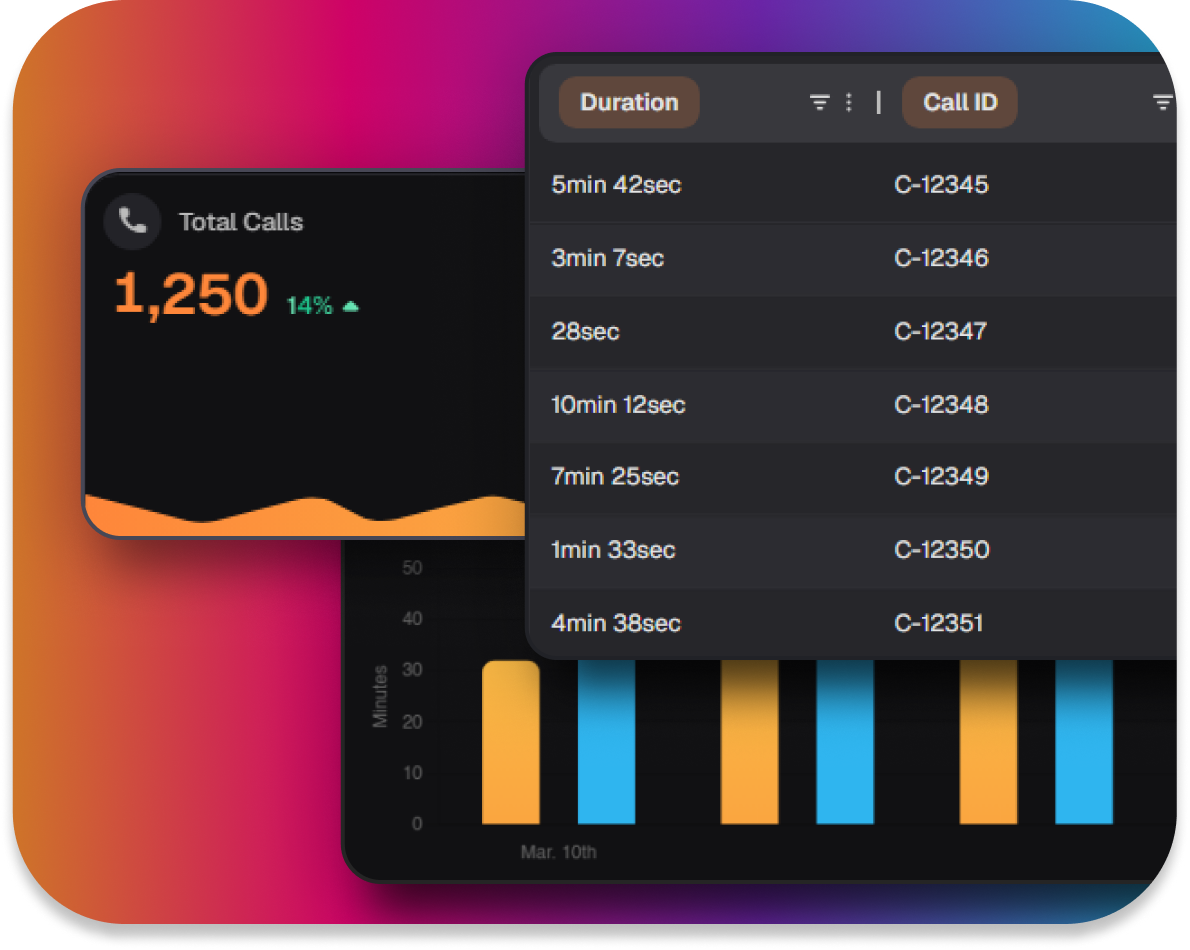
Three chart groups can be toggled on or off so each team sees what matters. A call table at the bottom connects these insights to individual records for deeper review.
Layered filtering for the right slice
Key filters like lines, vendors, owners, teams, call types, and transfer paths keep charts and the call table aligned to the same group.
Align leadership and floor supervisors on the same filtered call universe.
Spot workload, quality, and vendor effects without switching pages.
Move from overall metrics to individual calls when deeper investigation is needed.