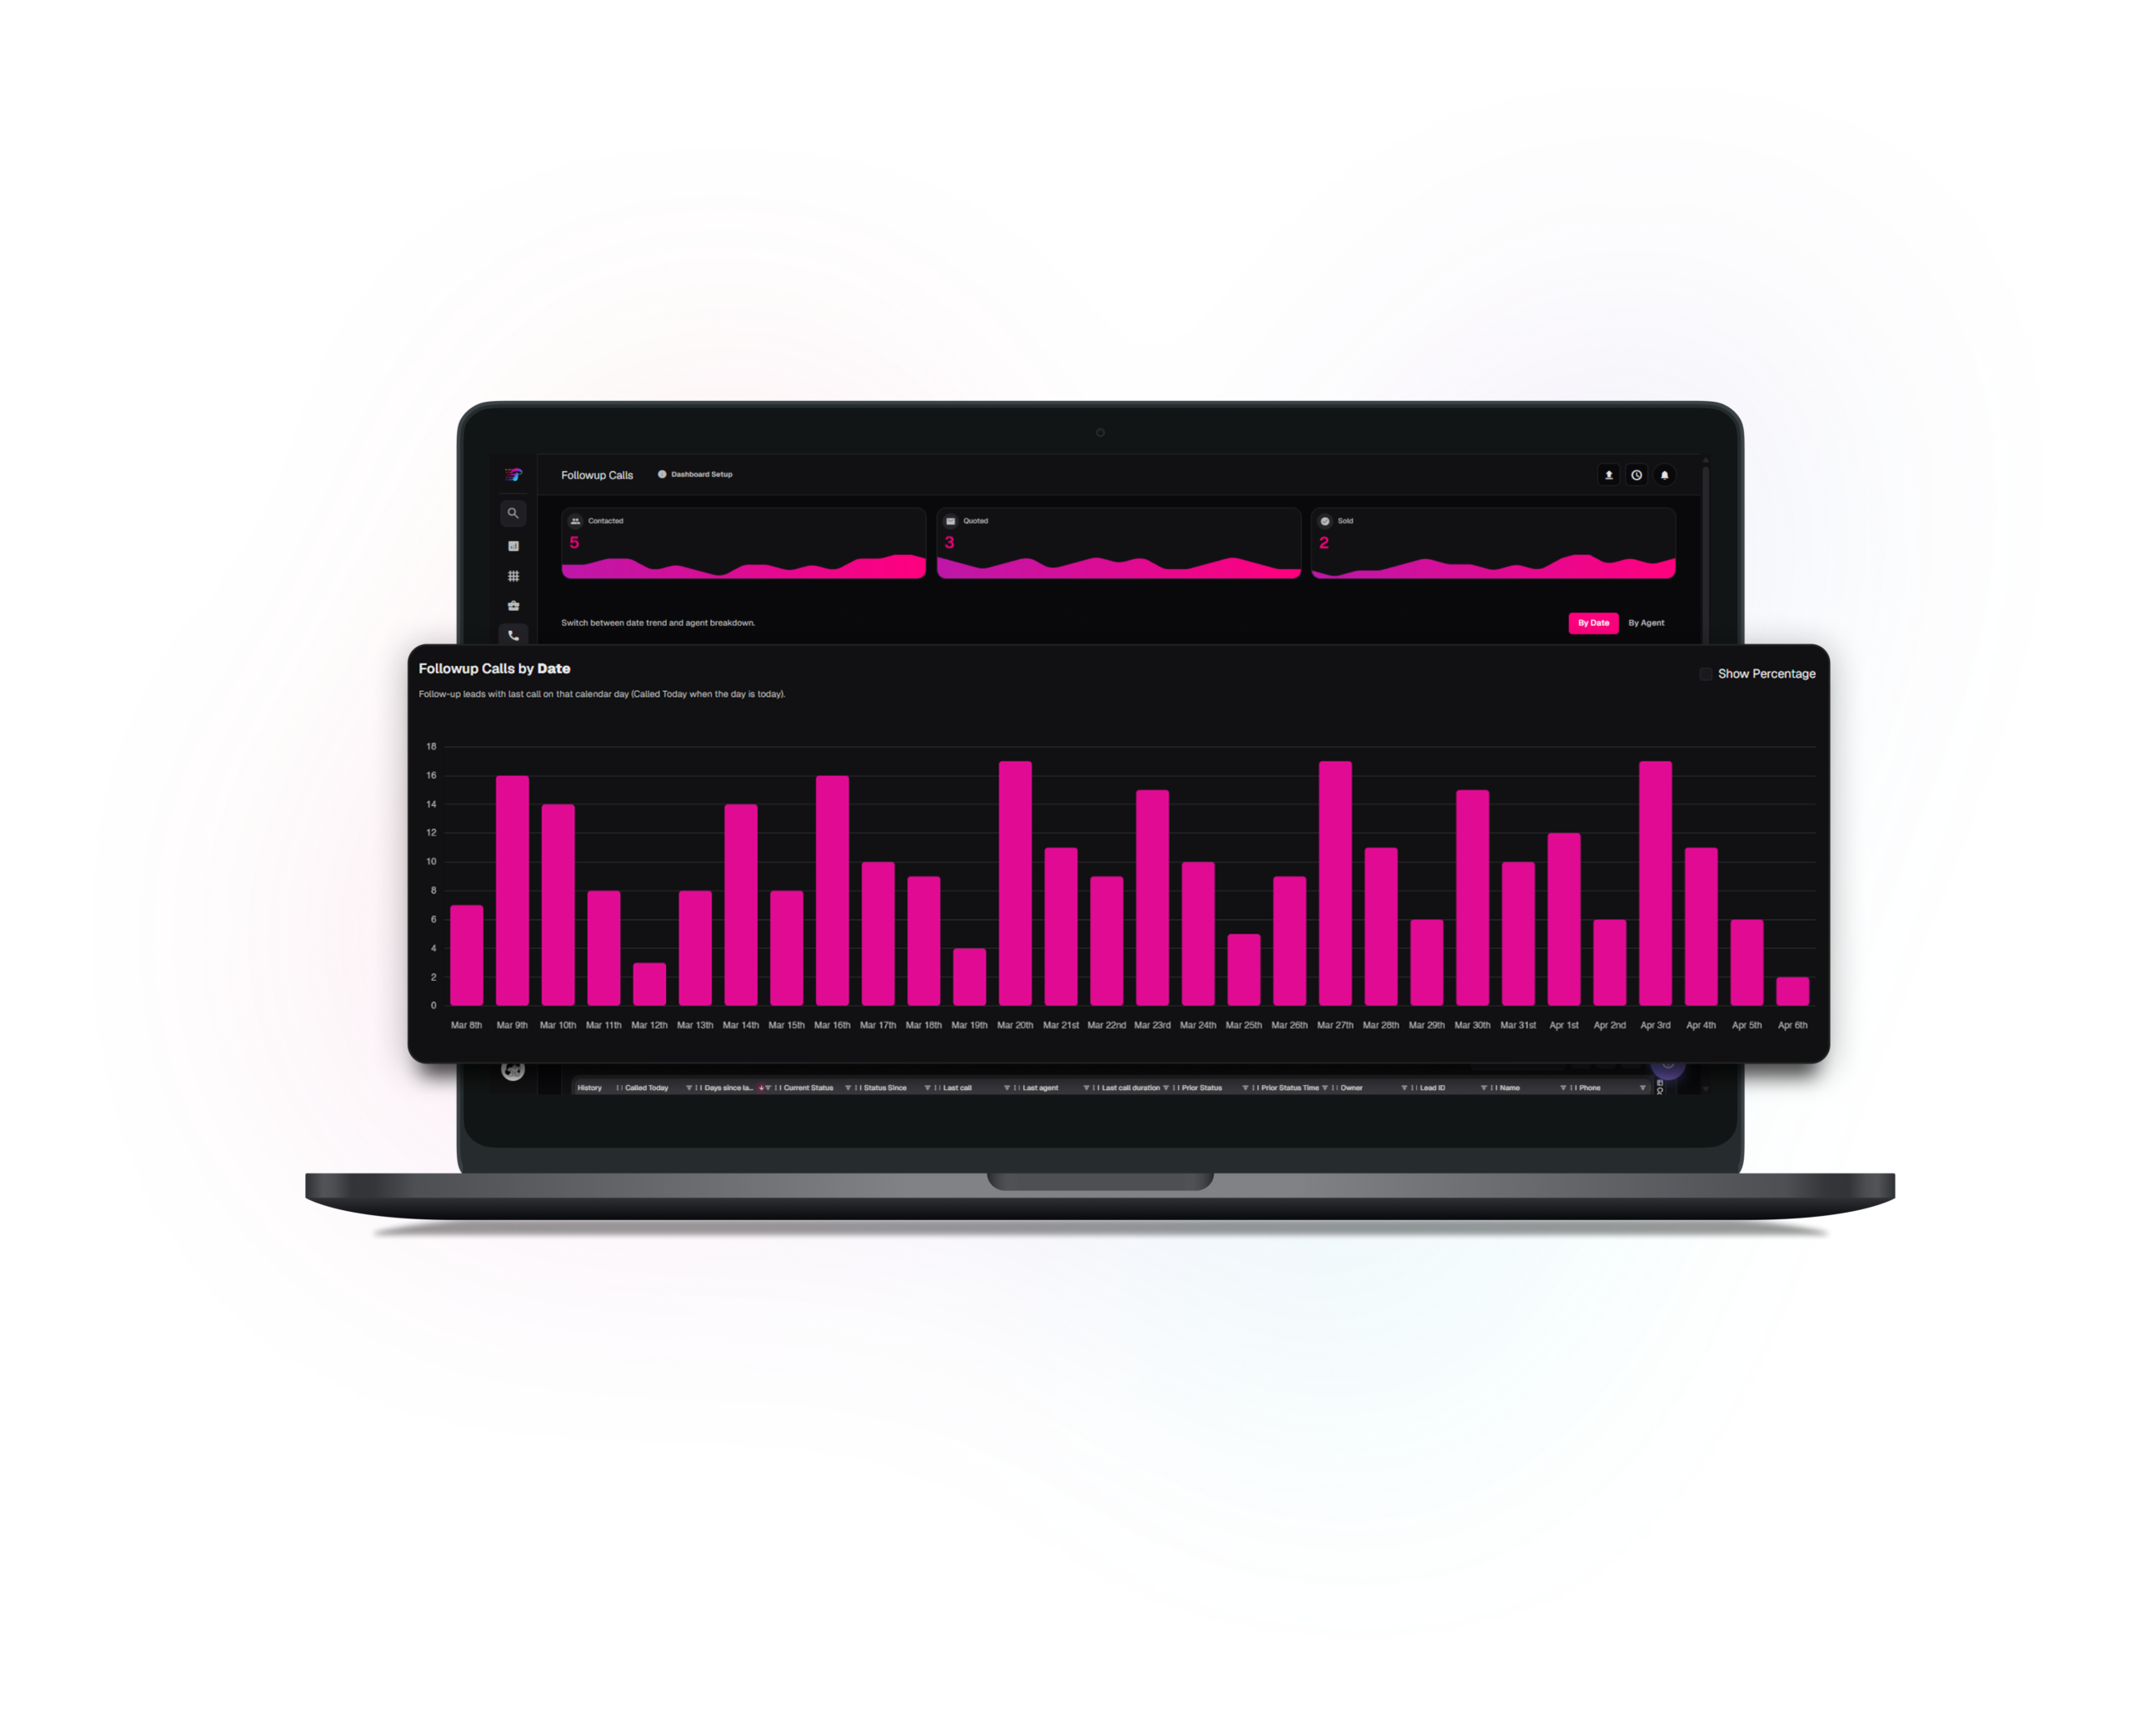
Focus on leads after first contact, showing how many move through contacted, quoted, and sold stages, how follow-up volume changes over time, and how agents compare. Charts switch between timeline and per-agent views, while the table includes filters and “days since last call” so managers can spot stalled leads and open rows to see follow-up history without leaving the page.
charts
Two chart lenses on the same dataset
Switch between date trends and agent breakdowns, with a compact date picker for quick day-by-day comparisons during standups and coaching.
filters
Filterable grid with expandable call history
The table includes filters for contacted, quoted, and sold, along with a min–max range for time since the last call. Rows can be expanded to review follow-up history and validate the numbers.