This page shows call and lead activity as clear time patterns. Adjust vendors, dates, days, teams, people, and hours, then view multiple perspectives side by side. It helps you spot when work builds up, when engagement is strongest, and how different parts of the business behave across the week.
grid
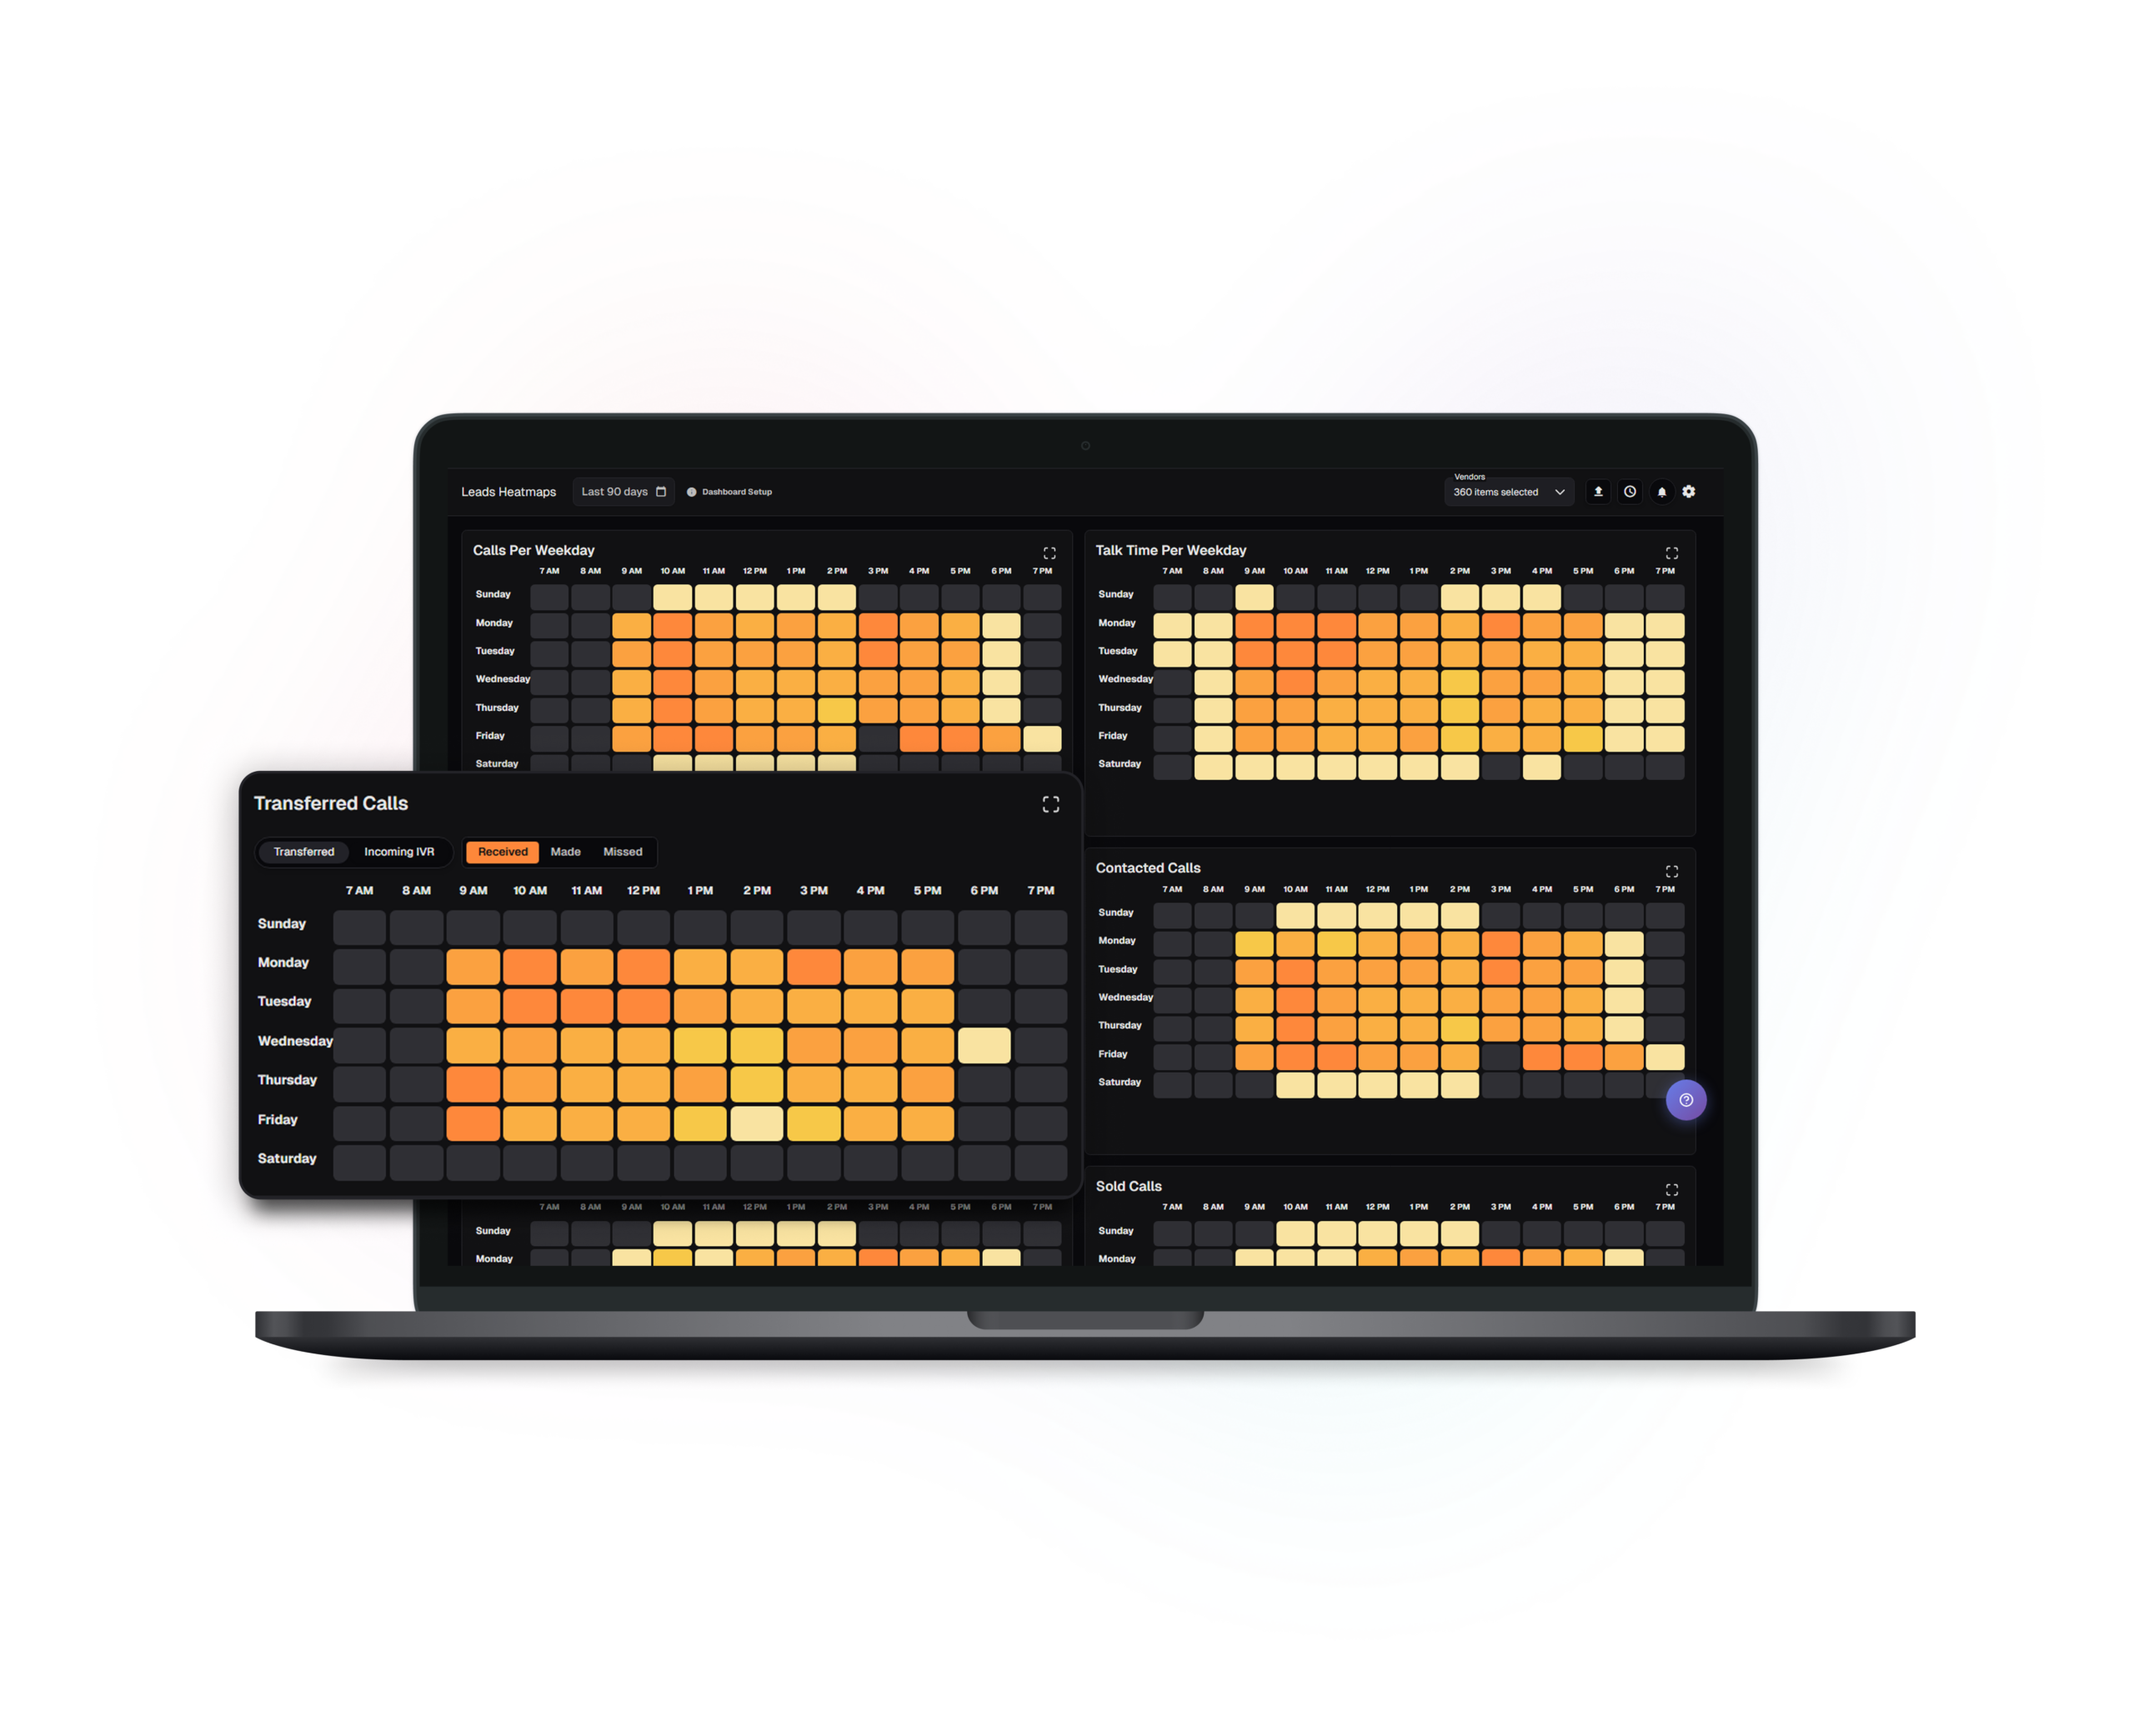
More than one view of the same timeline
A grid of heatmaps lets you compare overall activity with follow-up signals and outcomes, so patterns and exceptions are easy to see.
filters
Flexible filtering for the slice you care about
Filter by source, date range, day of week, owner, and team so the view fits the audience—whether it’s the floor, vendors, or leadership—without needing to re-explain the data.